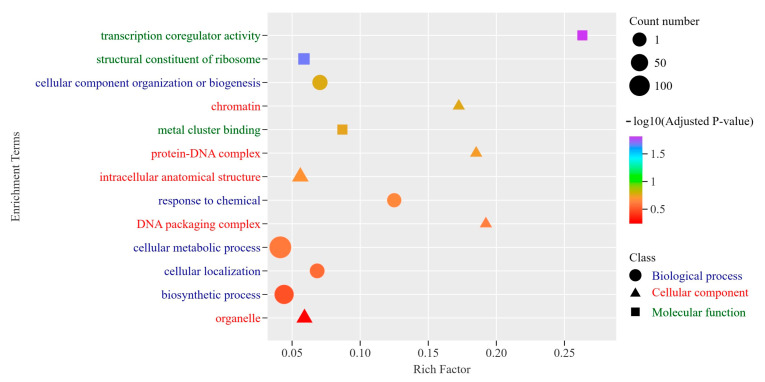
Figure 7.
GO enrichment analysis of ultra-conserved genes between M. lotungensis and M. sinica. The plot displays the enriched GO terms associated with the 951 ultra-conserved genes, categorized into three main classes: biological process (orange), cellular component (green), and molecular function (purple). The x-axis represents the rich factor, indicating the proportion of ultra-conserved genes in each GO term relative to the total number of genes in that term. The y-axis shows the enriched GO terms, and the size of the dots corresponds to the number of ultra-conserved genes in each term. The color scale on the right represents the adjusted p-value (−log10 transformed) for the enrichment significance.

