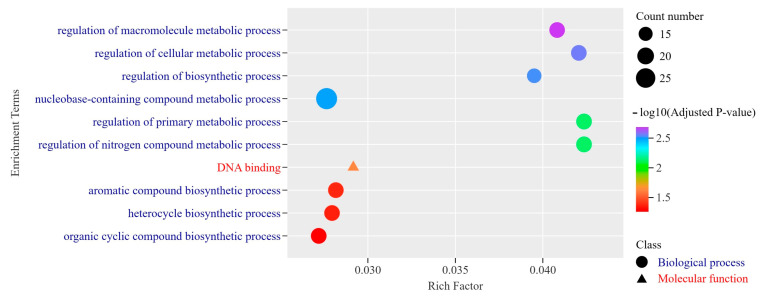
Figure 8.
Gene Ontology (GO) enrichment analysis of rapidly evolving genes in M. lotungensis compared to M. sinica or M. kwangsiensis. The bar plot displays the top 10 most significantly enriched GO terms associated with the 511 genes under positive selection (dN/dS > 1) in M. lotungensis. The GO terms are categorized into three main classes: biological process (blue), cellular component (green), and molecular function (orange). The x-axis represents the enrichment score, calculated as the −log10-transformed adjusted p-value for each GO term. The y-axis shows the enriched GO terms, with their corresponding GO IDs in parentheses.

