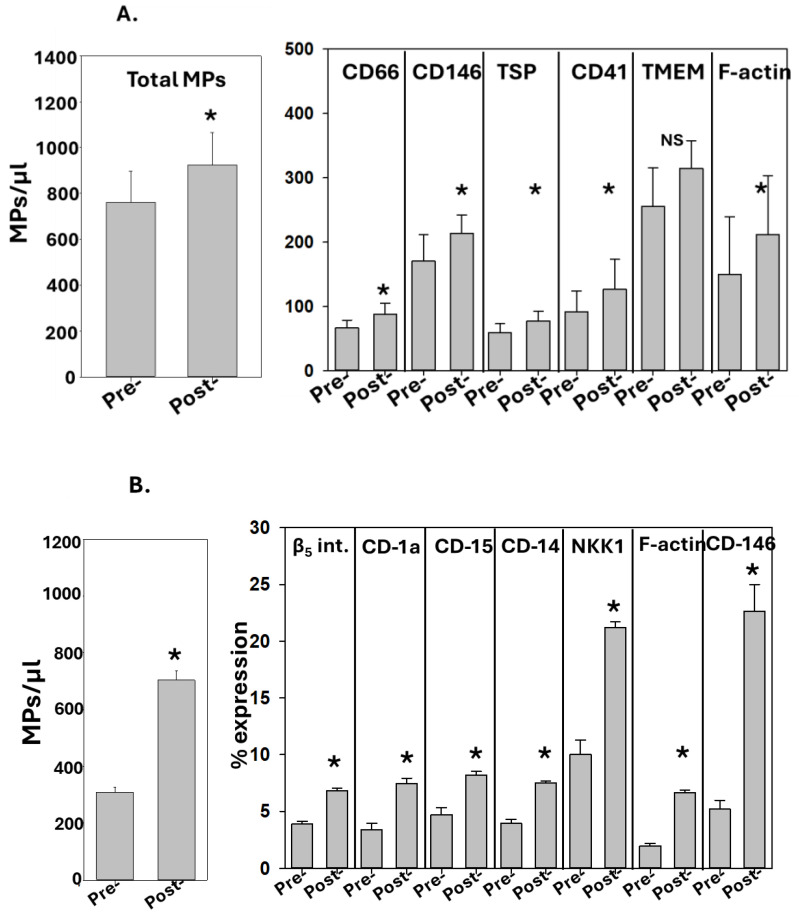
Figure 1.
MPs in diving subjects. The data show the MPs in (A) blood and (B) perspiration. Blood and perspiration were collected before and after a dive to 3.98 msw for 40 min, as described in the Methods. The sub-groups for blood MPs are represented as the number of MPs/µL and they display a significant increase post-dive as compared to pre-dive (mean ± SD, n = 5, * p < 0.05, paired t-test). The sub-groups for perspiration MPs are shown as the % of MPs expressing proteins specific to alternative cell types, as described in the text, with significant increases post-dive (mean ± SD, n = 5, * p < 0.001, paired t-test; NS indicates not statistically significant).

