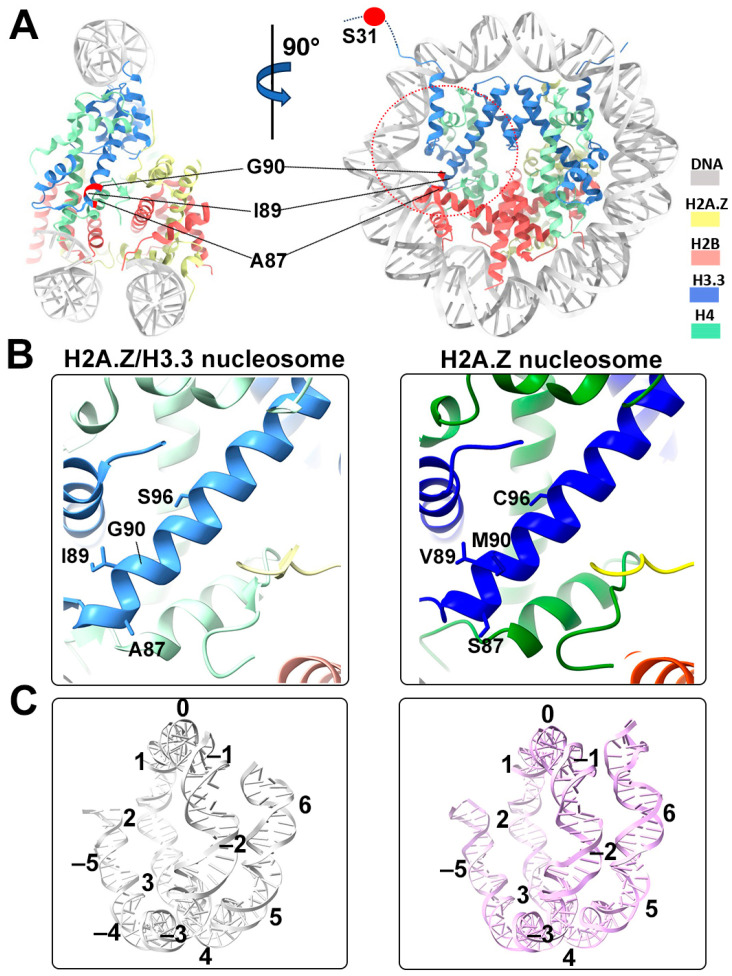
Figure 4.
Structural comparison of the H2A.Z nucleosome and double-variant nucleosome. (A) The five H3.3-specific residues are highlighted and labeled in the current model. To enhance clarity and illustrate the structure surrounding H3.3, we utilized global clipping planes in ChimeraX to cut away part of the structure. The far clipping plane was employed to create the model’s side view on the left, while the near clipping plane was utilized to generate the view on the right. Densities of the DNA and different histones are color-coded according to the label shown on the right. (B) Close-up view of the H3.3 α2 helix region (red dotted oval in (A)) in the H2A.Z-H3.3 nucleosome (left). The same region of histone H3.1 in the H2A.Z nucleosome is shown (right, PDB ID 71MX). The four H3.3-specific residues and their counterparts in H3.1 are labeled. The near clipping plane was employed. (C) Comparison of the DNA of the H2A.Z-H3.3 nucleosome (left) with the DNA of the H2A.Z nucleosome, showing slightly longer/more resolved DNA ends beyond SHL6 in the H2A.Z nucleosome. The superhelical locations are labeled.

