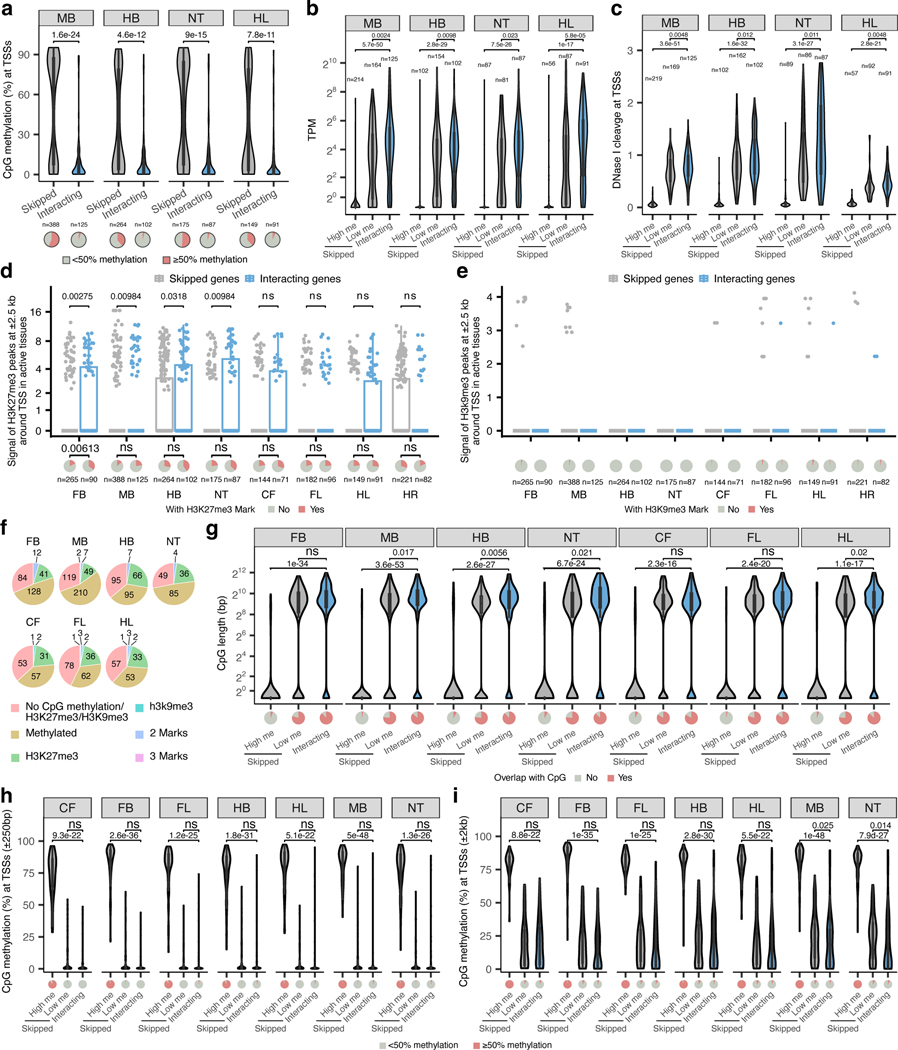
Extended Data Fig. 4. Properties of enhancer-interacting and skipped promoters.
a-c, The CpG methylation (a), mRNA expression levels (b) and DNase signal (c) of enhancer-interacting and skipped promoters in tissues where enhancers are active. High me, high methylation skipped promoters (>50% CpG methylation within ± 1 kb from TSS). Low me, low methylation skipped promoters (<50% CpG methylation within ± 1 kb from TSS). d,e, H3K27me3 (d), H3K9me3 (e) signal at ± 2.5 kb of enhancer-interacting and skipped promoters in tissues where enhancers are active. The pie charts below show the fraction of promoters marked with H3K27me3 or H3K9me3. f, Pie charts showing the fraction of skipped promoters marked by CpG methylation, H3K27me3, H3K9me3 or the combination of marks. g-i, Violin plot showing CpG length (g), or CpG methylation level at transcription start sites for enhancer-interacting and skipped genes with different window sizes ± 250bp (h) and ± 2kb (i)). The number of high and low methylated skipped as well as interacting promoters in CpG analysis are n =58, n =86 and n =71 (CF), n =138, n =126 and n =90 (FB), n =64, n =116 and n =96 (FL) and n =100, n =162 and n =102 (HB), n =55, n =92 and n =91 (HL), n =213, n =169 and n =125 (MB) and, n =87, n =86 and n =87 (NT). FB, forebrain. MB, midbrain. HB, hindbrain. CF, craniofacial mesenchyme. FL, forelimb. HL, hindlimb. NT, neural tube. HR, heart. P values are calculated by two-sided Wilcoxon rank test after adjusted for multiple testing (a-c, f-i) or by one-sided chi-squared test (d, e). A statistical test was not performed for H3K9me3 since most of the values are zero. The same DNA methylation, mRNA expression, DNaseI hypersensitivity, H3K27ac and H3K9me3 dataset (a mixture of fore- and hindlimb buds) were used for both fore- and hindlimb interaction analyses. For the boxplots in panels a-e and g-i, the central horizontal lines are the median, with the boxes extending from the 25th to the 75th percentiles. The whiskers further extend by ±1.5 times the interquartile range from the limits of each box.

