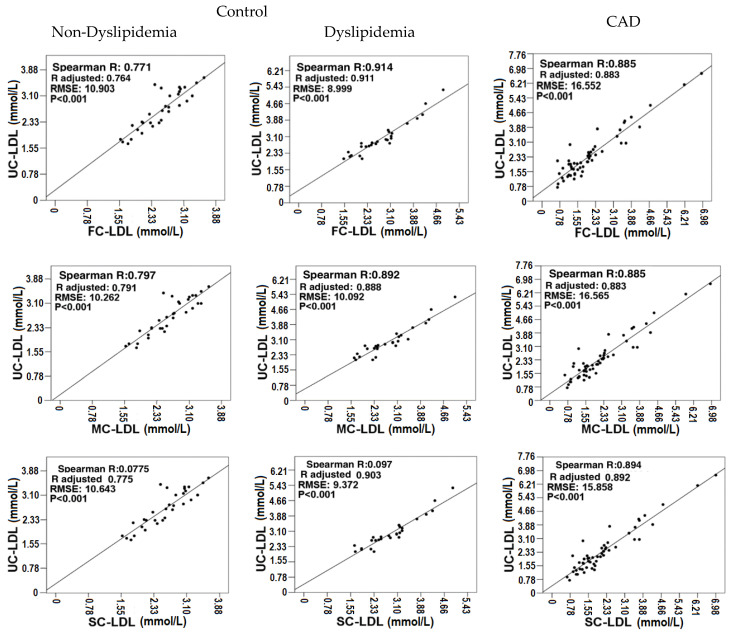
Figure 1.
Correlation graphs of ultracentrifugation with the three equations, in both controls and EAC. Spearman R correlation coefficient. Adjusted R: adjusted Spearman correlation coefficient. RMSE: root mean square error. Statistical significance with p < 0.05. FC (Friedewald quantification), MC (Martin quantification), SC (Sampson quantification), UC (ultracentrifugation quantification).

