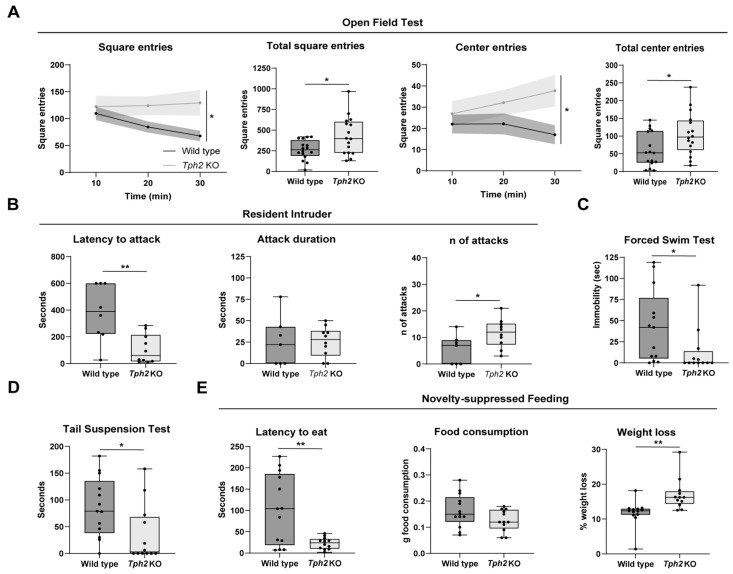
Figure 1.
Behavioral tests on Tph2 knockout mice. (A) In the graphs relative to the Open Field Test are shown the number of square entries relative to the time spent in the arena (Two-way ANOVA, interaction time × genotype, F (2, 30) = 3.675, p = 0.0374, followed by Sidak’s multiple comparison tests, at 20′, p = 0.0121; at 30′, p = 0.0001), the total number of square entries (Unpaired t test, t = 2.618, df = 30, p = 0.0137), the number of center square entries relative to the time of experiment (Two-way ANOVA, genotype effect, F (1, 15) = 4.677, p = 0.0471, followed by Sidak’s multiple comparison tests, at 30′, p = 0.0003), and the total number of center entries (Unpaired t test, t = 2.279, df = 30, p = 0.0300); WT n = 16; KO n = 16. (B) Box plot relative to the Resident–Intruder test in which are shown the latency of the first attack (Unpaired t test, t = 2.301, df = 15, p = 0.0361), the attack duration (Unpaired t test, t = 0.03170, df = 15, p = 0.9751), and the total number of attacks for WT and KO mice (Unpaired t test, t = 2.301, df = 15, p = 0.0361); WT n = 8; KO n = 10. (C) The graph shows the immobility of WT and KO mice in the Forced Swim Test (Unpaired t test, t = 2.078, df = 23, p = 0.0491); WT n = 13; KO n = 12. (D) Box plot showing the immobility measured in the Tail Suspension Test (Unpaired t test, t = 2.306, df = 23, p = 0.0305); WT n = 13; KO n = 12. (E) Results of the Novelty-Suppressed Feeding Test expressed as latency of eating (Unpaired t test, t = 3.314, df = 23, p = 0.0030), quantity of food consumed (Unpaired t test, t = 1.732, df = 23, p = 0.0967), and weight loss (Unpaired t test, t = 3.217, df = 23, p = 0.0038); WT n = 13; KO n = 12. Data are expressed as means ± min/max for box plots and ±s.e.m. for XY graphs, with * p < 0.05 and ** p < 0.01.

