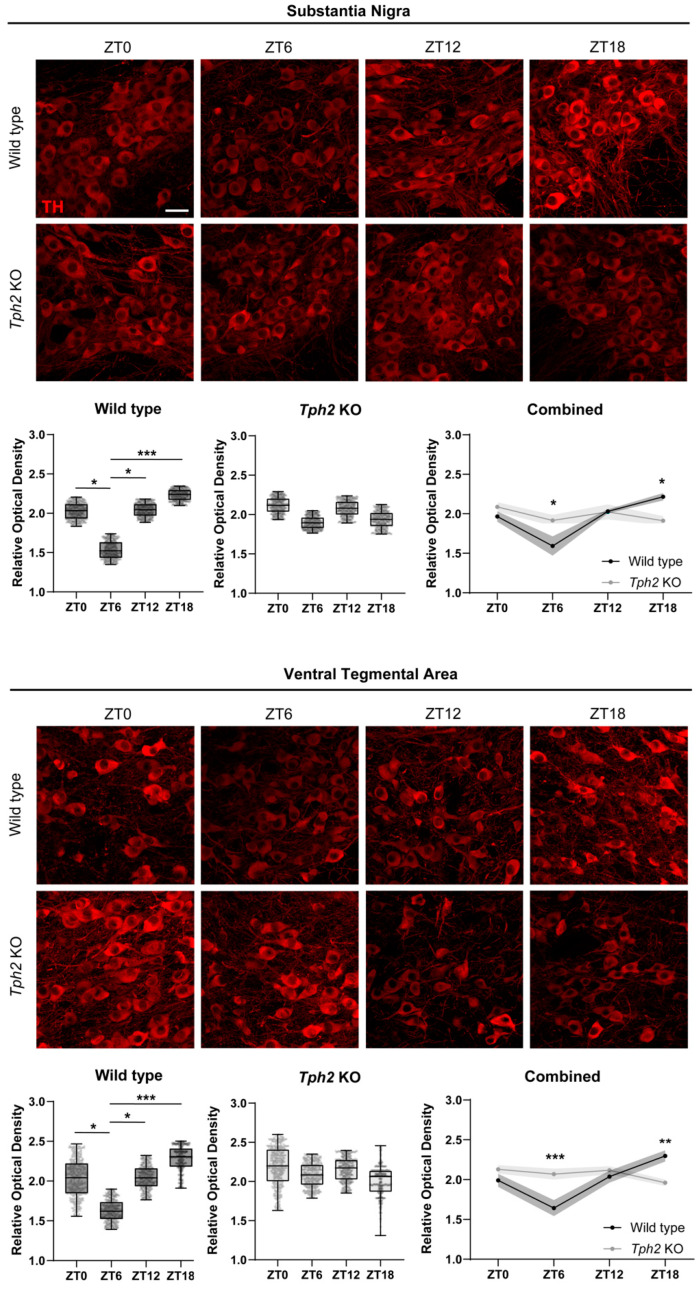
Figure 2.
Disruption of daily oscillations of tyrosine hydroxylase in midbrain dopaminergic nuclei. Representative images showing TH immunoreactivity in both Substantia Nigra pars compacta (top of the panel) and Ventral Tegmental area (bottom panel) at ZT0, ZT6, ZT12, and ZT18 (Scale bar 30 μm). Box plots show an intra-genotype comparison of TH immunofluorescence levels measured as ROD at the different ZTs (WT cohorts in SN: One-way ANOVA, F (3, 12) = 14.02, p = 0.0003, followed by Tukey’s multiple comparison test: ZT0 vs. ZT6 p = 0.0124; ZT6 vs. ZT12 p = 0.0039; ZT6 vs. ZT18 p = 0.0002. KO cohorts in SN: One-way ANOVA, F (3, 12) = 1.523, p = 0.2591. WT cohorts in VTA: One-way ANOVA, F (3, 12) = 11.73, p = 0.0007, followed by Tukey’s multiple comparison test: ZT0 vs. ZT6 p = 0.0381, ZT6 vs. ZT12 p = 0.0180, ZT6 vs. ZT18 p = 0.0004. KO cohorts in VTA: One-way ANOVA, F (3, 12) = 2.431, p = 0.1157). TH expression levels between WT and KO mice are compared at different circadian time points. (SN: Two-way ANOVA, interaction time x genotype, F (3, 24) = 7.086, p = 0.0014, followed by Tukey’s multiple comparison test: KO vs. WT at ZT6 p = 0.0487, KO vs. WT at ZT18 p = 0.0042. VTA: Two-way ANOVA, interaction time x genotype, F (3, 24) = 11.24, p < 0.0001, followed by Tukey’s multiple comparison test: KO vs. WT at ZT6 p = 0.0097, KO vs. WT at ZT18 p = 0.0050). WT n = 5, KO n = 5 per timepoint. Data are expressed as means ± min/max for box plots and ±s.e.m. for XY graphs, with * p < 0.05, ** p < 0.01, and *** p < 0.001.

