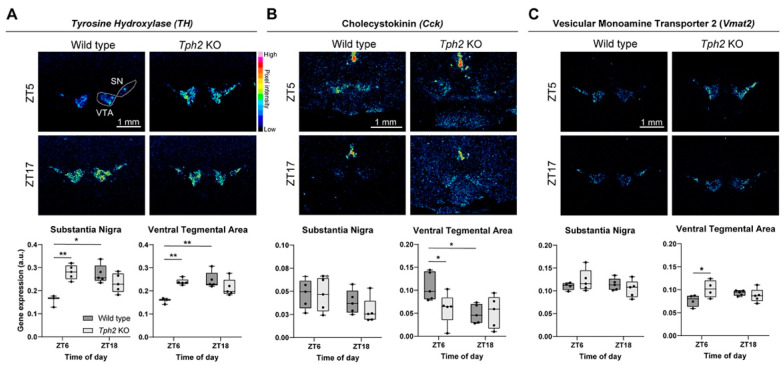
Figure 3.
Altered daily rhythms in mRNA levels of tyrosine hydroxylase, cholecystokinin, and vesicular monoamine transporter 2. (A) Representative autoradiogram of coronal sections showing Th mRNA expression. Box plots show gene expression levels in both SN and VTA measured as relative optical density at ZT6 and ZT18 (SN: Mixed-effect model, time x genotype interaction, F (1, 14) = 37.47, p = 0.0009, followed by Sidak’s multiple comparison test: WT ZT6 vs. ZT18 p = 0.0016, WT vs. KO at ZT6 p = 0.0006. VTA: Mixed-effects model, time × genotype interaction, F (1, 14) = 16.92, p = 0.0011, followed by Sidak’s multiple comparison test: WT ZT6 vs. ZT18 p = 0.0008, WT vs. KO at ZT6 p = 0.0017). (B) Representative images of 35S ISH showing Cck expression and graphs of relative optical density quantification (SN: Two-way ANOVA followed by Sidak’s multiple comparison test; this analysis did not reveal any effects. VTA: Two-way ANOVA, in which no effect was found; Sidak’s multiple-comparison test: WT ZT6 vs. ZT18 p = 0.025, WT vs. KO at ZT6 p = 0.0276). (C) Representative images of 35S ISH showing Vmat2 expression at ZT6 and ZT18. In box plots are shown the relative optical density quantifications (SN: Mixed-effecst model followed by Sidak’s multiple comparison test; no effect was found. VTA: Mixed-effect model, interaction time × genotype, F (1, 14) = 5.747, p = 0.0310, followed by Sidak’s multiple comparison test, WT vs. KO at ZT6 p = 0.0386). WT n = 5 KO n = 5 per timepoint. Data are expressed as means ± min/max; * p < 0.05 and ** p < 0.01. Scale bar: 1 mm.

