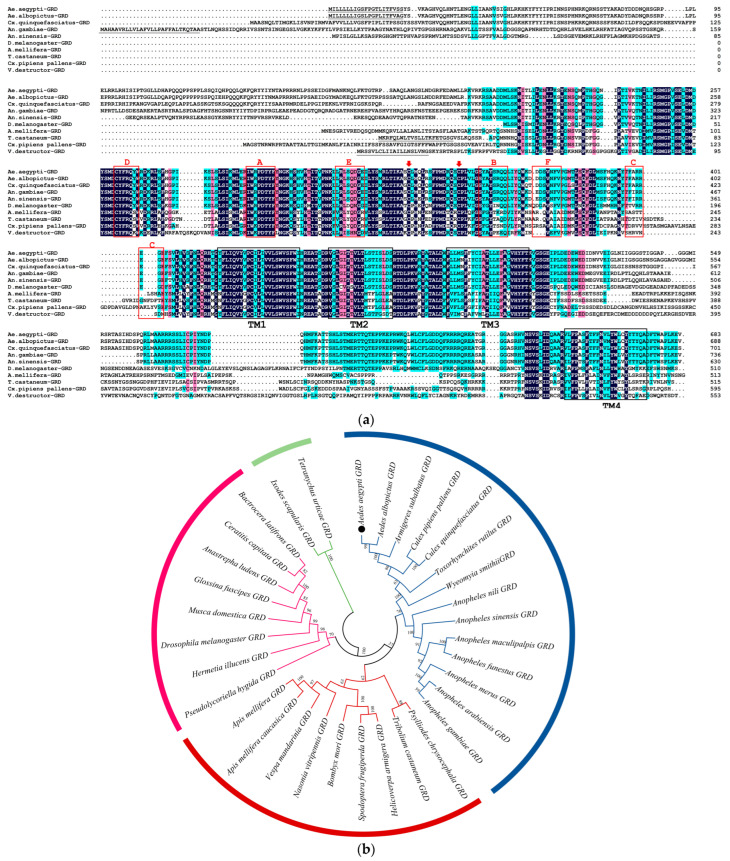
Figure 2.
Sequence analysis of Ae-GRD: (a) Amino acid sequence comparison and analysis of GRD subunits in Ae. aegypti and other insects. Sequence homology is highlighted as dark blue for sequences with ≥100% homology, pink for ≥75% homology, and light blue for ≥50% homology. Key structural features are indicated: red arrows highlight two typical cysteine residues characteristic of the cys-loop LGICs, gray underlining denotes signal peptide regions at the N-terminus, black boxes outline the four transmembrane domains (TM1-TM4), and red boxes identify ligand-binding related structural domains (loops A–F). (b) Phylogenetic tree of GRD proteins of Ae. aegypti and other insects. The numbers above the branches represent the bootstrap values for each branch (1000 replications). The black dot showed the sequence of Ae-GRD in our study. Taxonomically related organisms are shown by the same color code.

