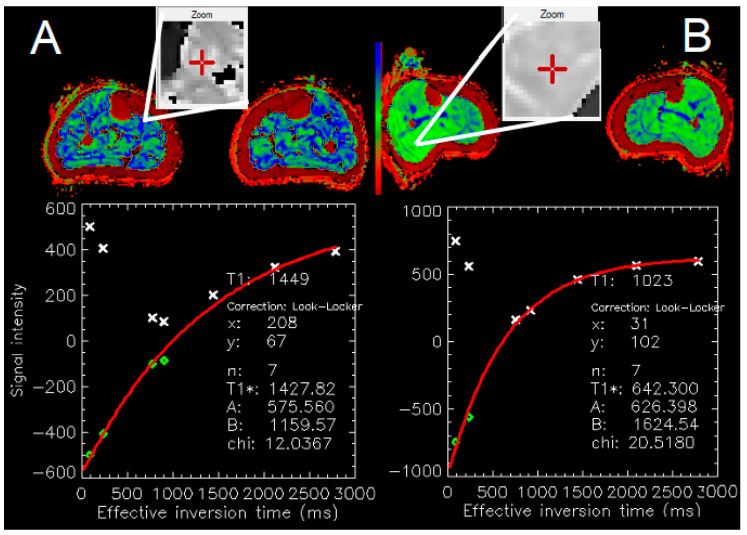
Figure 1.
3T MRI MOLLI T1 map (mid-calf level). Panel (A): PAD patient. Zoom area from the soleus muscle. Panel (B): Matched control. Zoom area: soleus/gastrocnemius muscle. Note the significantly higher T1 values in the PAD patient (1449 ms) vs. control (1023 ms). MRMap [20], PRISM color-table.

