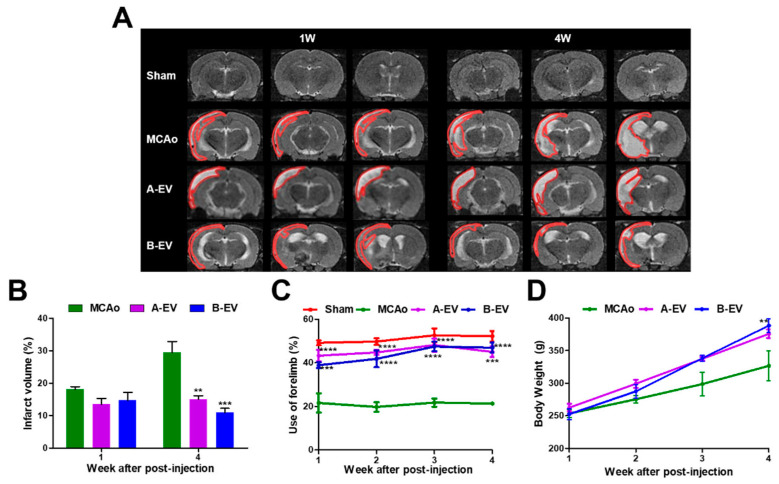
Figure 5.
The protective effects of A-EVs and B-EVs in an in vivo ischemic model. (A) T2 MRI images of each group were taken in the first and fourth week after surgery. The infarct areas are represented with red lines. Scale bar indicates 10 μm. (B) Measurement of infarct volume was observed at one and four weeks after surgery. (C) Behavioral tests were conducted every week until four weeks. (D) Determination of bodyweight for four weeks. All experiments were repeated at least three times. ** p < 0.01, *** p < 0.001, and **** p < 0.0001 compared with the MCAo group.

