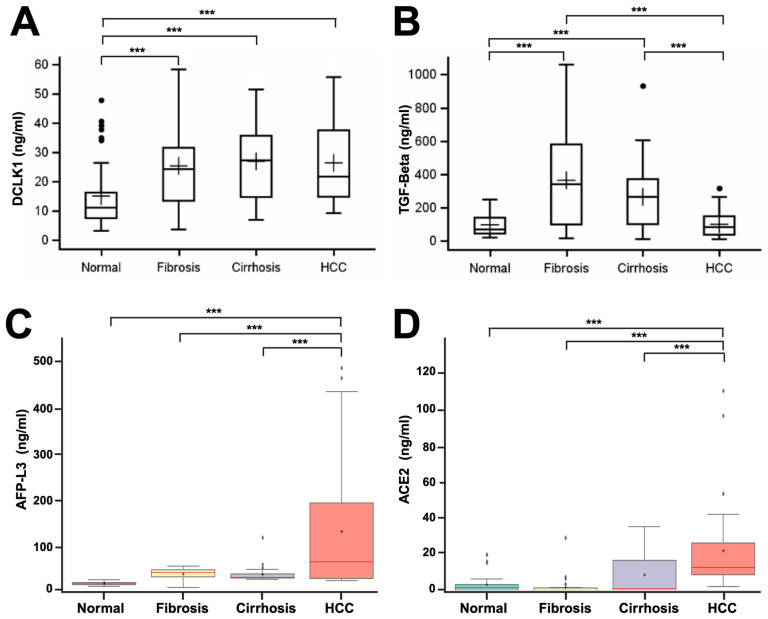
Figure 1.
Differential blood sera protein expression of key factors in liver disease progression. Boxplots of protein levels from ELISAs performed on 168 serum samples, including 40 normal, 50 fibrosis, 50 cirrhosis, and 28 HCC patients to determine relative protein levels in these samples. (A) DCLK1 serum levels in patients show elevated fibrosis, cirrhosis, and HCC levels. (B) TGF-β show increased levels in fibrosis and cirrhosis compared with normal liver, but normal levels in HCC sera. (C,D) AFP-L3 and ACE2 protein levels were significantly elevated in HCC only. Dots represent outliers. ‘***’—p value < 0.01 compared with normal, ‘+’—mean.

