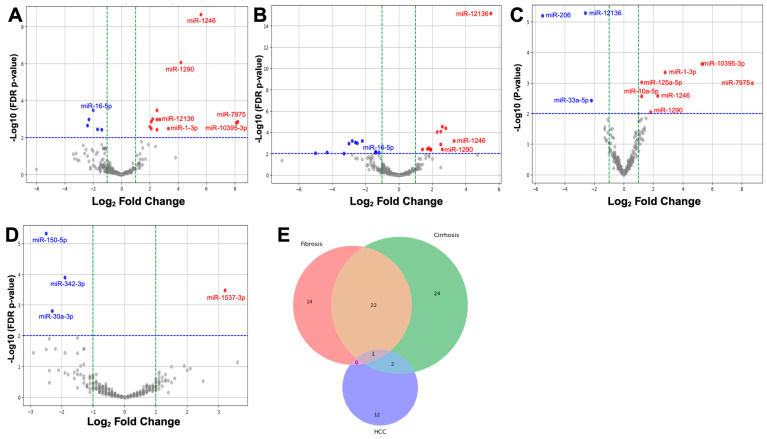
Figure 3.
Differentially expressed (DE) miRNAs in fibrosis, cirrhosis, and HCC patient sera. (A–C) Volcano plots of indicated patient sera compared with normal liver patient sera using the false detection rate (FDR) p value threshold of <0.01. The log2FC indicates the mean expression level for each miRNA (dot). Red dots represent up-regulated and green represents down-regulated miRNAs. The blue line presents the significance threshold and green lines the expression cutoffs. (A) Fibrosis miRNAs in sera from fibrosis patients showing upregulation or downregulation relative to normal liver patient sera. Some miRNAs have been labeled for comparison. (B) Similar plot to (A) but with the cirrhosis patient sera compared with normal. (C) Comparison of fibrosis patient sera miRNAs versus cirrhosis patient sera miRNAs. (D) HCC sera showed different DE miRNAs than those seen in fibrosis or cirrhosis. (E) Venn diagram of DE miRNA clustering into unique fibrosis, cirrhosis, and HCC as well as each overlapping grouping.

