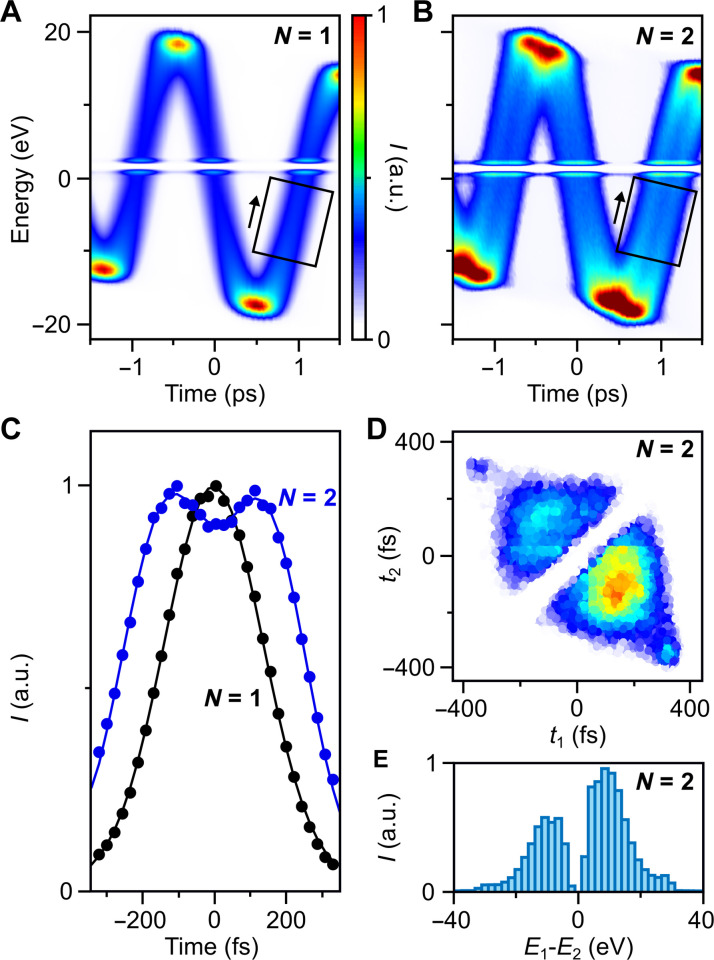
Fig. 6. Multi-electron phase-space characterization and control.
(A) Measured spectrogram for one-electron states (N = 1). (B) Measured spectrogram for two-electron states (N = 2). Black rectangles, regions of interest for our further analysis; white lines, artefacts from our detector system. (C) Measured electron arrival times for exactly one electron (black) and exactly two electrons per pulse (blue). (D) Measured pair density as a function of arrival times t1 and t2 for electrons 1 and 2 within a pair. Data are recorded at terahertz time delay of 1.1 ps. (E) Measured histogram of energy differences E1-E2 within a pair state after terahertz-driven energy magnification. The initial separation of ~2 eV (49, 50) becomes ~15 eV.

