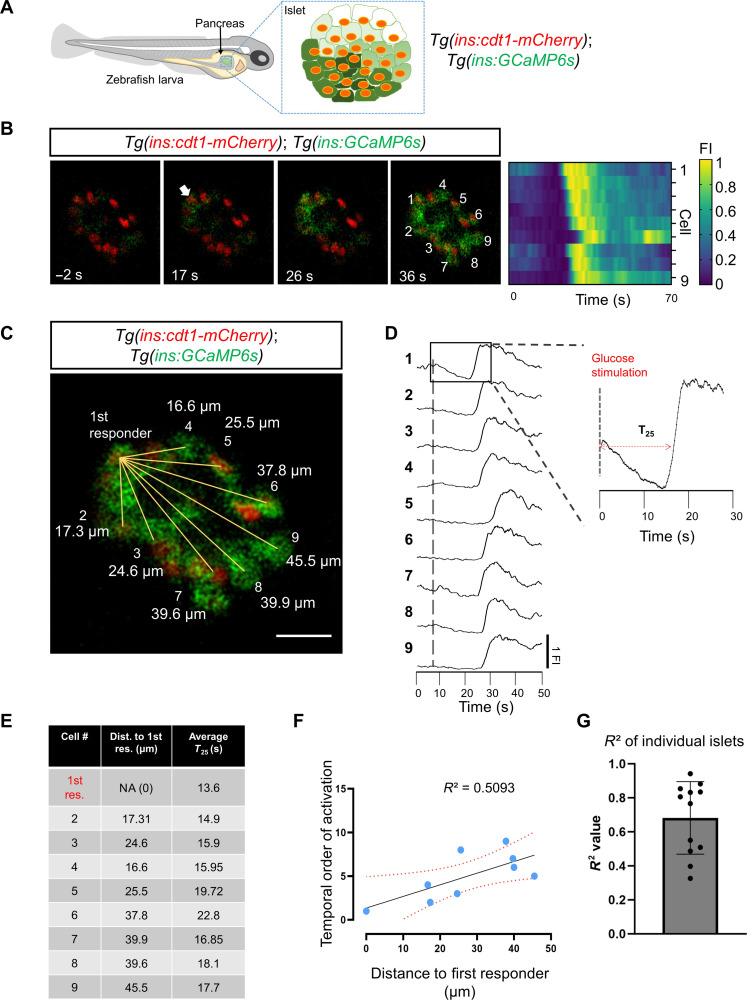
Fig. 1. Calcium imaging in vivo reveals a proximity relationship between first-responder and follower cells.
(A) Schematic representing a transgenic zebrafish expressing the genetically encoded calcium indicator GCaMP6 (green) and the nuclear marker cdt1-mCherry (red) in β cells. The insulin promoter expresses GCaMP6 in β cells, while cdt1-mCherry specifically labels the nuclei of β cells. (B) Snapshots from time-lapse recordings and raster plots of the primary islet at 6 Hz. The time stamp indicates the relative time to the glucose injection. The white arrow points to the β cell that responded first to the glucose stimulus. (C) The distance measured from the nuclei of the first-responder cell to the rest of the cells shown in (B). Scale bar, 10 μm. (D) Individual fluorescent traces from the cells shown in (B). (E) The table shows the distance (in μm) to the first-responder cell and the individual time of response (defined as a >25% increase in GCaMP6 fluorescence after glucose injection, T25). (F) Graph plotting the temporal order of activation of each cell versus the distance to the first responder from the islet shown in (B). The dotted line shows a linear regression and the associated R2 value. Each dot represents one cell. (G) The average R2 value was 0.609 with a ±SD of 0.27 (n = 12 independent samples). Data are shown as means ± SD. Cartoon of zebrafish larva in (A) reproduced with explicit permission from Nature Metabolism (www.nature.com/natmetab/)

