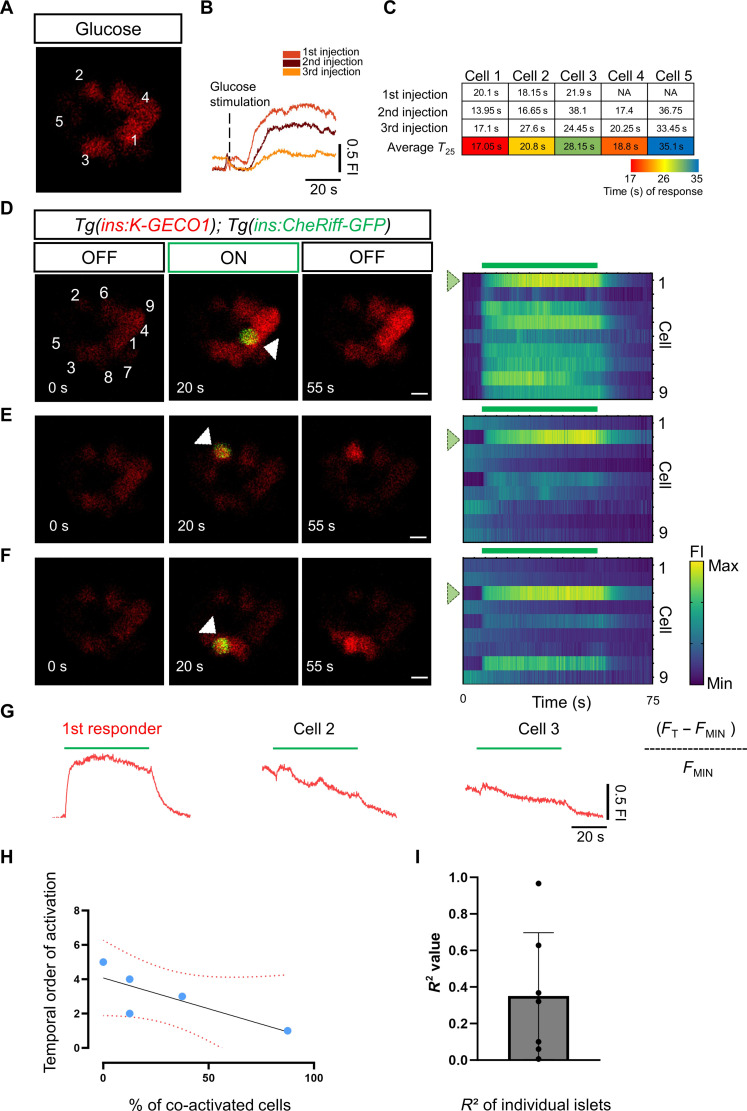
Fig. 4. Combining CheRiff activation with glucose stimulation shows that first responders occupy the top of the functional hierarchy.
(A) Image from a time-lapse recording at 6 Hz of the islet after a glucose injection. The traces (B) show the cumulative normalized K-GECO1 fluorescence traces after glucose stimulation. Glucose was injected at 5-min intervals. (C) The table shows the time of response for individual cells (K-GECO1 fluorescence increase to >25% above baseline). The cells are numbered according to their position in (A). The table shows a color key of the relative time of response for individual cells to each glucose injection. (D to F) Representative images and raster plots from the time-lapse recordings show the optogenetic activation of cells from the islet in (A). The optogenetic activation was performed via an ROI scan encompassing the area of one cell. The white arrowhead points to the illuminated β cell. (G) The traces show the cumulative normalized K-GECO1 fluorescence traces for β cells outside of the area of illumination. The blue bar indicates the period of blue laser exposure. (H) Graph plotting the percentage of co-activated β cells versus the time of response for each cell. The dotted line shows a linear regression and the associated R2 value. Each dot represents one cell. (I) The average R2 value from seven samples was 0.316 with a ±SD of 0.265 (n = 39 cells from seven independent samples). Data are shown as means ± SD. Scale bars, 10 μm.

