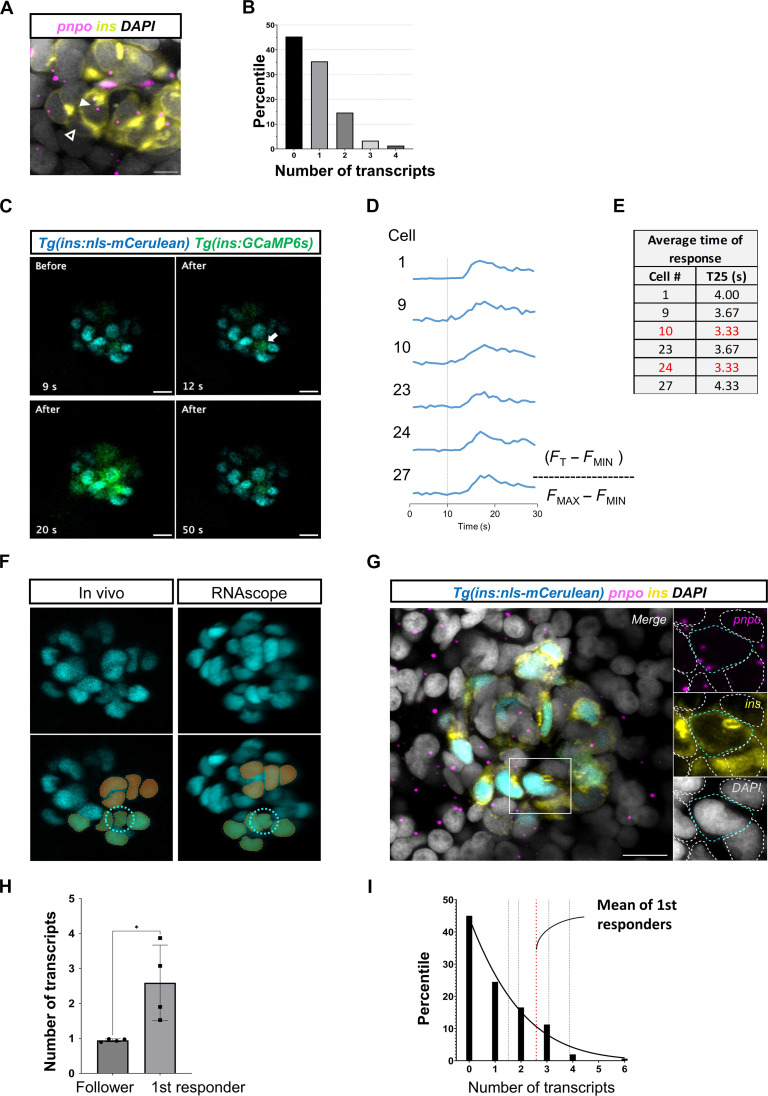
Fig. 6. pnpo marks first-responder β cells.
(A) RNAscope analysis of pnpo expression in β cells in the islets of zebrafish larvae (5 dpf). (B) Individual β cells show a heterogeneous number of pnpo transcripts. Most cells have zero transcripts. A small proportion (5%) of the cells have three and four transcripts (n = 5 independent samples). β Cells are shown in yellow using insulin immunofluorescence and pnpo transcripts are in magenta. The white arrowhead points to a pnpo-positive β cell with two pnpo transcripts. The dark arrowhead points to a pnpo-negative β cells. (C) Representative Ca2+ responses to glucose injection. The images represent maximum projections of confocal slices spanning the whole islet. (D) Fluorescent traces from individual selected cells. (E) Speed of response of selected cells from the time-lapse imaging. (F) The β cells from the in vivo imaging were matched with maps of pnpo transcripts following RNAscope analysis of pnpo expression. A nuclear fluorescent reporter (blue) was used as for cell matching of β cells and recognizable landmarks (pseudocolors) were used to match the cells. (G) The expression of pnpo is shown for the first-responder cell identified using the time-lapse shown in (C). β Cells are shown in yellow using insulin immunofluorescence, and pnpo transcripts are in magenta. (H) Comparison of average number of transcripts between first-responder and follower cells (n = 4 independent samples). (I) Percentile distribution of β cells according to number of pnpo transcripts (n = 4 independent samples). The mean transcript number for first-responder β cells is indicated with a red line. Unpaired two-tailed t tests; *P = 0.0286. Data are shown as means ± SEM. Scale bars, 10 μm.

