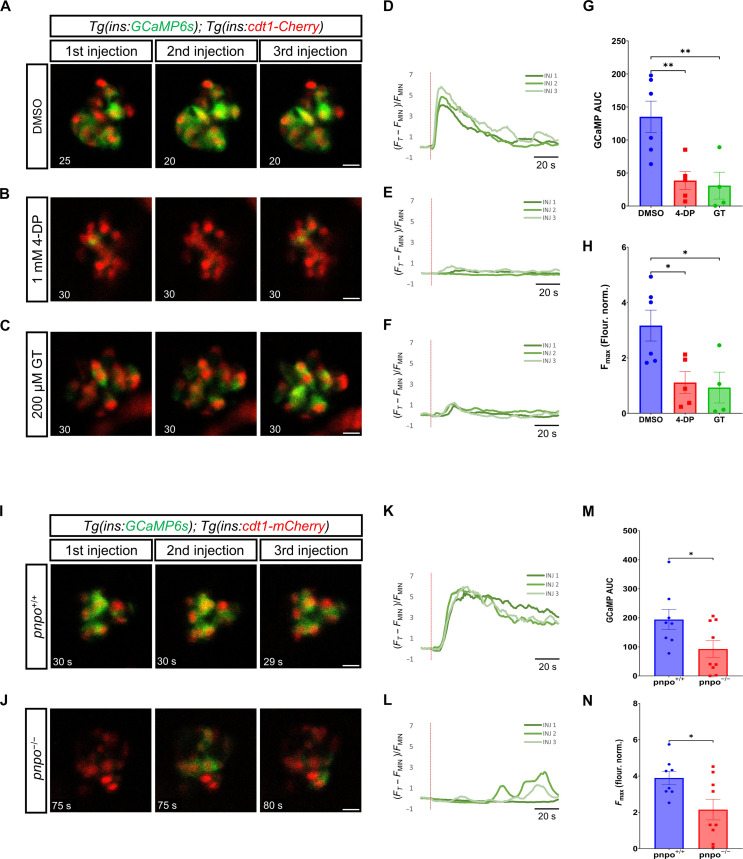
Fig. 7. pnpo and vitamin B6 are necessary for the β cell Ca2+ response to glucose in zebrafish.
(A to C) Time lapse of β cell Ca2+ activity upon triple-glucose stimulation of Tg(ins:GCaMP6s);Tg(ins:cdt1-mCherry) larvae treated with dimethyl sulfoxide (DMSO), 1 mM 4-deoxypyridoxine (4-DP), or 200 μM ginkgotoxin (GT). The panels show frames with high β cell activity following each stimulus (single focal-plane imaging at 1 Hz for 120 s). Glucose injection was performed at the 10th second of each recording. The time stamp shows time relative to the start of recording. (D to F) Normalized GCaMP fluorescence traces. Red lines indicate glucose injection. (G) AUC of normalized GCaMP fluorescence after glucose injection for DMSO, 4-DP, and GT. Each dot represents the average of three glucose stimulations per sample (n = at least four independent samples per group). One-way ANOVA with Dunnett’s correction. **P = 0.0090 for DMSO versus 4-DP; **P = 0.0084 for DMSO versus GT. (H) Maximum GCaMP fluorescence (Fmax) recorded throughout the imaging for DMSO, 4-DP, and GT (n = at least four independent samples per group). One-way ANOVA with Dunnett’s correction. *P = 0.0235 for DMSO versus 4-DP; *P = 0.0210 for DMSO versus GT. (I and J) Time lapse of β cell Ca2+ activity in pnpo+/+ and pnpo−/− larvae (5 dpf). Imaging parameters as in (A). (K and L) Normalized fluorescence traces. Red lines indicate glucose injection. (M) AUC of normalized GCaMP fluorescence for pnpo+/+ and pnpo−/−. Each dot represents the average of three glucose stimulations per sample (n = at least eight independent samples per group). Unpaired two-tailed t test, *P = 0.0388. (N) Maximum GCaMP fluorescence (Fmax) recorded throughout the imaging for pnpo+/+ and pnpo−/−. Unpaired two-tailed t test, *P = 0.0248. Each dot represents the average of three stimulations (n = at least eight independent samples per group). Data are shown as means ± SEM.

