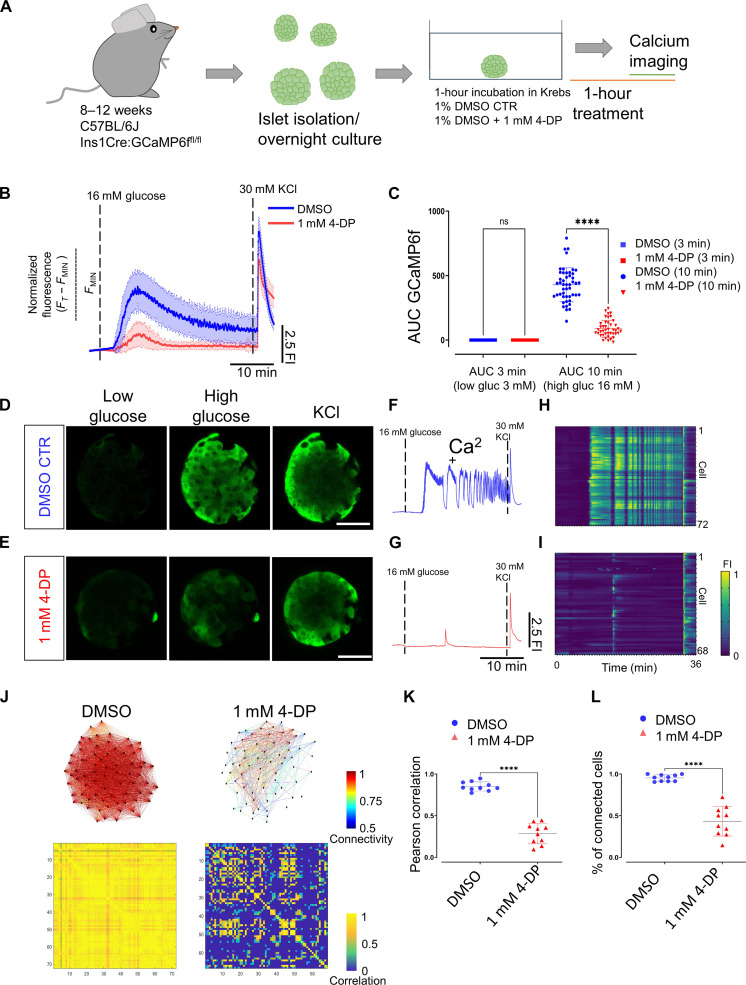
Fig. 8. Vitamin B6 antagonism reduces the Ca2+ response and the β cell coordination in mouse islets.
(A) Experimental design for in vitro calcium imaging of islets from male C57BL/6J Ins1Cre:GCaMP6ffl/fl mice aged 10 weeks with 4-DP treatment. (B) Average calcium fluorescent traces from control and 1 mM 4-DP–treated islets. The blue and red lines show average GCaMP6f fluorescent traces and SDs from the imaged islets. (C) AUC quantifications from controls and 1 mM 4-DP–treated islets at 3 and 10 min. Each dot represents an islet (one-way paired ANOVA, Tukey’s correction ****P = 1.60 × 10−73; 48 islets for 1% DMSO controls and 42 islets for 1 mM 4-DP, from three mice). (D and E) Snapshots from a time-lapse recording of the individual islet at 0.5 Hz before and after glucose stimulation and KCl depolarization from control and 1 mM 4-DP treatment. (F and G) Normalized GCaMP6f fluorescence traces upon glucose stimulation (16 mM glucose) and 30 mM KCl depolarization from control and 1 mM 4-DP–treated islet shown in (D) and (E). (H and I) Raster plots show the GCaMP6f signal for individual cells from islets shown in (D) and (E). (J) Connectivity map and Pearson correlation matrix of the islets in (D) and (E) during the first-phase response. (K) Pearson correlation of individual islets (unpaired two-tailed Student’s t test. ****P = 3.87 × 10⁻⁸) during the first-phase response. (L) Percentage of connected cells of individual islets during the first-phase response. n = 10 islets from three mice (1% DMSO) and n = 10 islets from three mice (1 mM 4-DP) (unpaired two-tailed Student’s t test. ****P = 9.47 × 10⁻¹¹). Data are shown as means ± SD. Scale bars, 40 μm.

