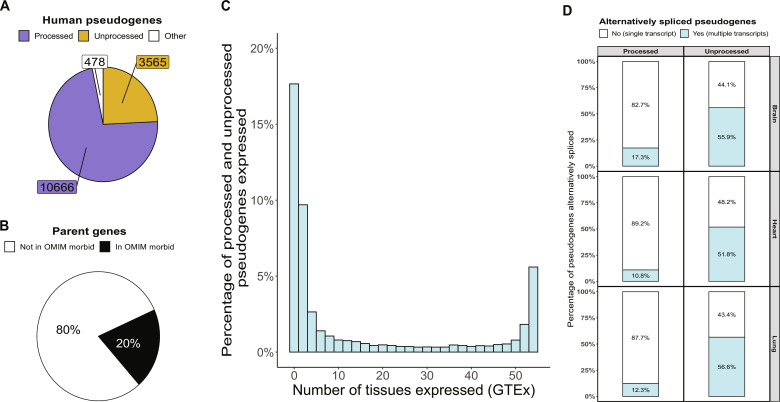
Fig. 2. Pseudogenes are frequent and expressed across human tissues.
(A) Pie chart showing the number of annotated pseudogenes that represent processed, unprocessed, or other pseudogenes. Other pseudogenes include unitary, IG (inactivated immunoglobulin), and TR (T cell receptor) pseudogenes. (B) Pie chart depicting the percentage of parent genes that are OMIM disease genes (https://omim.org). (C) Histogram showing tissue expression of pseudogenes as assessed using uniquely mapping reads (generated by the GTEx Consortium, v8). (D) Stacked bar chart depicting alternative splicing of pseudogenes using untargeted long-read RNA-seq data from ENCODE (https://www.encodeproject.org/rna-seq/long-read-rna-seq/), including 29 samples from brain (n = 9), heart (n = 16), and lung (n = 6).

