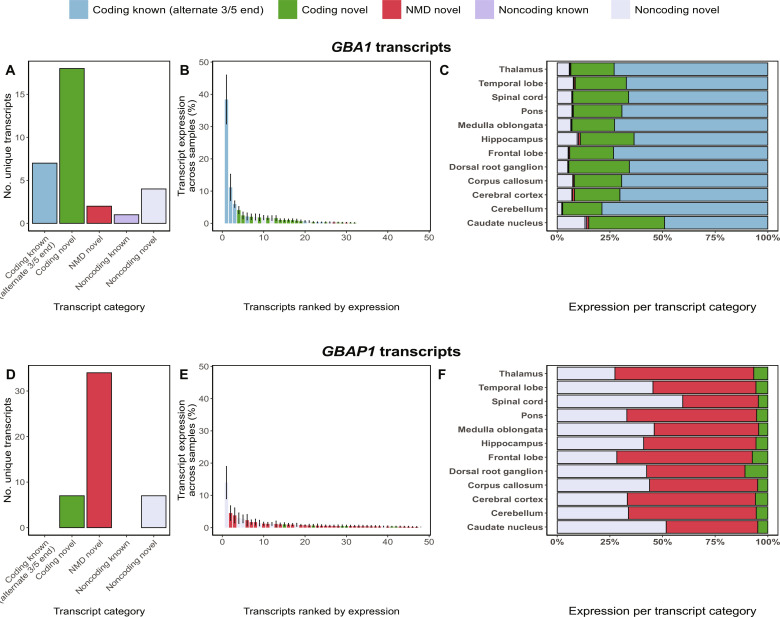
Fig. 4. Targeted long-read RNA-seq of GBA1 and GBAP1 identifies frequent novel transcription.
(A) Bar chart depicting the number of unique GBA1 transcripts identified per transcript category through targeted long-read RNA-seq across 12 human brain regions. (B) Normalized expression per GBA1 transcript corresponding to the percentage of expression per transcript out of total expression of the loci. (C) Stacked bar chart showing expression per transcript category of GBA1 across 12 human brain regions. (D) Bar chart depicting the number of unique GBAP1 transcripts identified per transcript category through targeted long-read RNA-seq across 12 human brain regions. (E) Normalized expression per GBAP1 transcript corresponding to the percentage of expression per transcript out of total expression of the loci. (F) Stacked bar chart showing the expression per transcript category of GBAP1 across 12 human brain regions.

