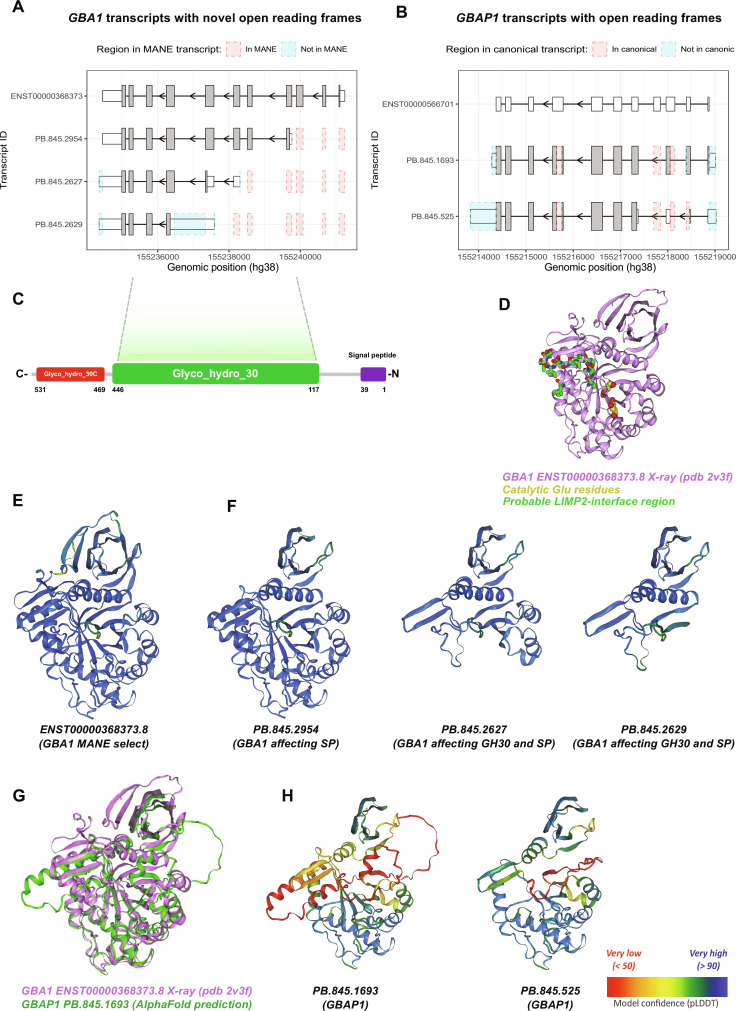
Fig. 5. Novel proteincoding transcripts of GBA1 and GBAP1 share a similar structure at the C terminus but with partial or full loss of key domains.
(A) Novel coding GBA1 transcripts plotted using ggtranscript with differences as compared to MANE select (ENST00000368373) highlighted in blue and red. (B) Novel predicted coding GBAP1 transcripts plotted using ggtranscript with differences as compared to ensemble canonical (ENST00000566701) highlighted in blue and red. (C) Schematic representation of GBA1 with the signal peptide (amino acids 1 to 39), glyco_hydro_30 (amino acids 117 to 446), and glycol_hydro_30C (amino acids 469 to 531). (D) X-ray structure of GBA1 (PDB 2v3f), with catalytic Glu residues highlighted in yellow and probable LIMP-2 interface region highlighted in purple. (E) AlphaFold2 predictions of GBA1 MANE select (ENST00000368373) and (F) the three most highly expressed novel protein-coding GBA1 isoforms colored by prediction confidence score (pLDDT). (G) X-ray structure of GBA1 (PDB 2v3f) (violet) superimposed on AlphaFold2 predicted structure of the longer ORF generated by GBAP1 PB.845.1693 (green). (H) AlphaFold2 predictions of the two most highly expressed novel protein-coding GBAP1 isoforms colored by prediction confidence score (pLDDT).

