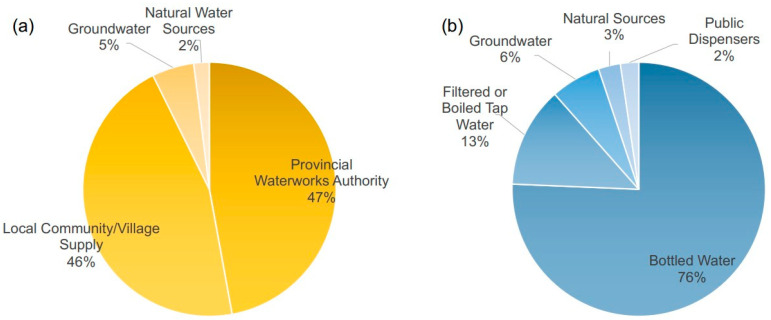
Figure 3.
Water Sources for 1036 Residents around Ubonrat Dam and Lam Nam Pong River, 2019. (a) Daily water usage primarily comes from the Provincial Waterworks Authority (47.55%) and local community/village supply (45.92%), with lesser amounts from groundwater (5.42%) and natural sources (2%). (b) Drinking water preferences show that the majority use bottled water (75.65%), followed by filtered or boiled tap water (12.8%), groundwater (6.4%), natural sources (2.81%), and public dispensers (2.33%). Note: The percentages provided are rounded for simplicity in the chart representation.

