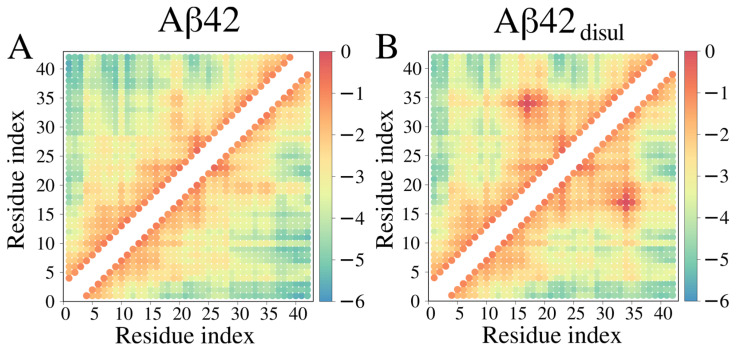
Figure 9.
Contact maps obtained from coarse-grained structures of Aβ42 (A) and Aβ42disul (B) generated in the Martini simulations with λ = 1 (no scaling of solute-solvent interactions). The color scale indicates the natural logarithm of contact frequency. The points in red, yellow, and blue represent frequent, transient, and rare contacts, respectively.

