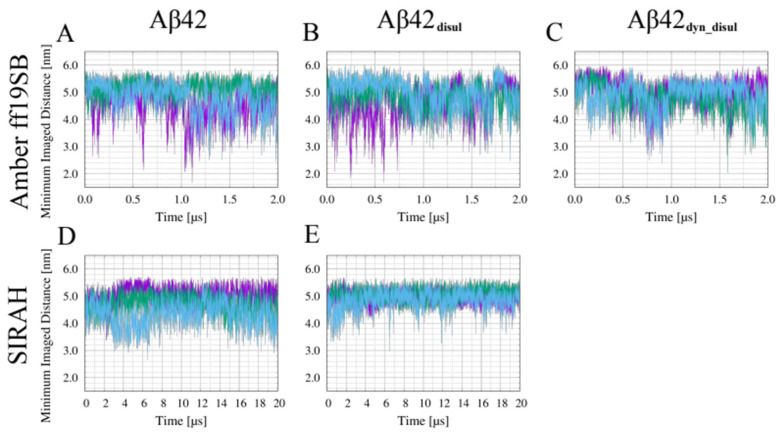
Figure A3.
Time evolution of the minimum non-self image distance in the all-atom Amber ff19SB simulations of Aβ42 (A), of Aβ42 with the static disulfide bond (B), and of Aβ42 with the dynamic disulfide bond (C), as well as in the SIRAH coarse-grained simulations of Aβ42 (D) and of Aβ42 with the static disulfide bond (E). Different colors are used to indicate various trajectories.

