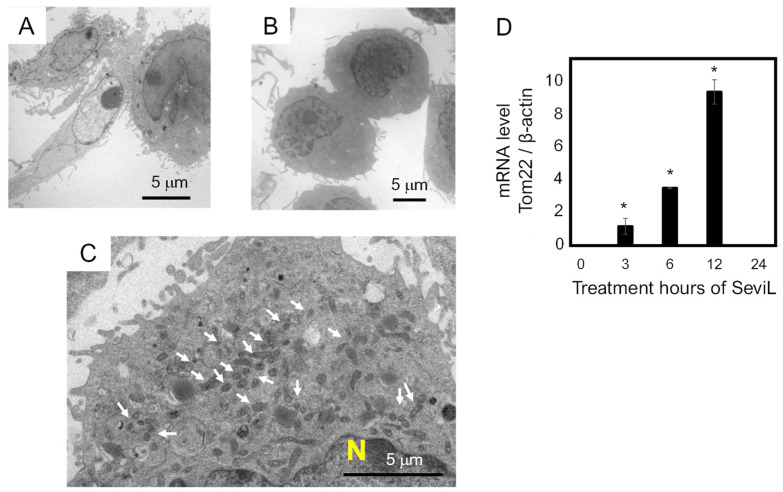
Figure 5.
Morphological changes in RAW264.7 macrophage cells observed via transmission electron microscopic analysis. Panel (A) shows the morphological features of RAW264.7 cells. Panels (B,C) show the RAW264.7 cells after treatment with SeviL. The arrows in panel C show an increase in the number of mitochondria. Panel (D) shows the mRNA level of Tom22 quantified via quantitative PCR. The scale bars in (A–C) indicate 5 μm. The data shown are the means ± SE (n = 3). p-values (* p < 0.05).

