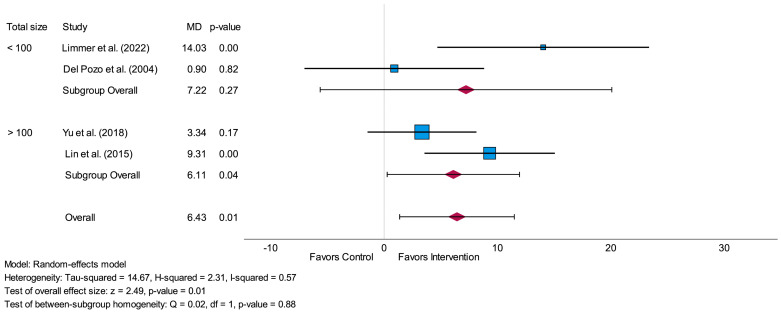
Figure 5.
Forest plot of subgroup-analysis related to the time-domain parameter SDNN measured in milliseconds (short-term) comparing the results of studies with a total sample size of fewer than 100 participants to studies with a total sample size of more than 100 participants. MD = mean difference [29,30,31,32].

