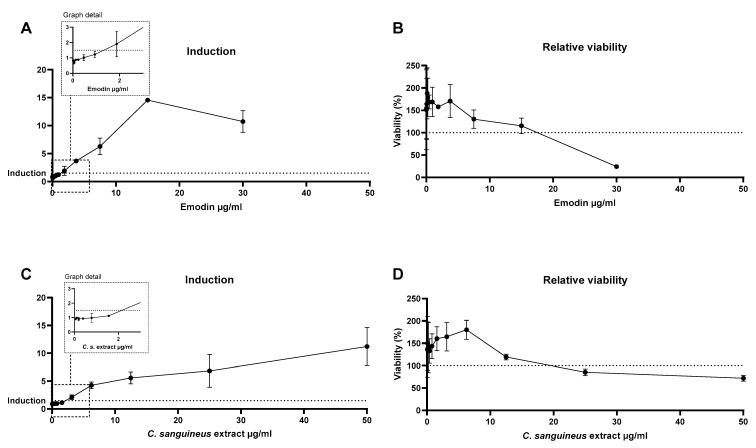
Figure 7.
The skin sensitisation assay results depicting the Nrf2 gene induction levels and relative keratinocyte viability after 48 h exposure to emodin or C. sanguineus aglycone extract. (A) shows the result of emodin induction and its effect on viability (B). Panel (C) shows the induction after the extract exposure and (D) cell viability after exposure to the extract. The extract precipitated at 100 µg/mL, causing total cell death and the result was omitted from the figure (D). The induction points for emodin and the extract are highlighted in the graph details. Data are shown as mean ± SD; n = 2.

