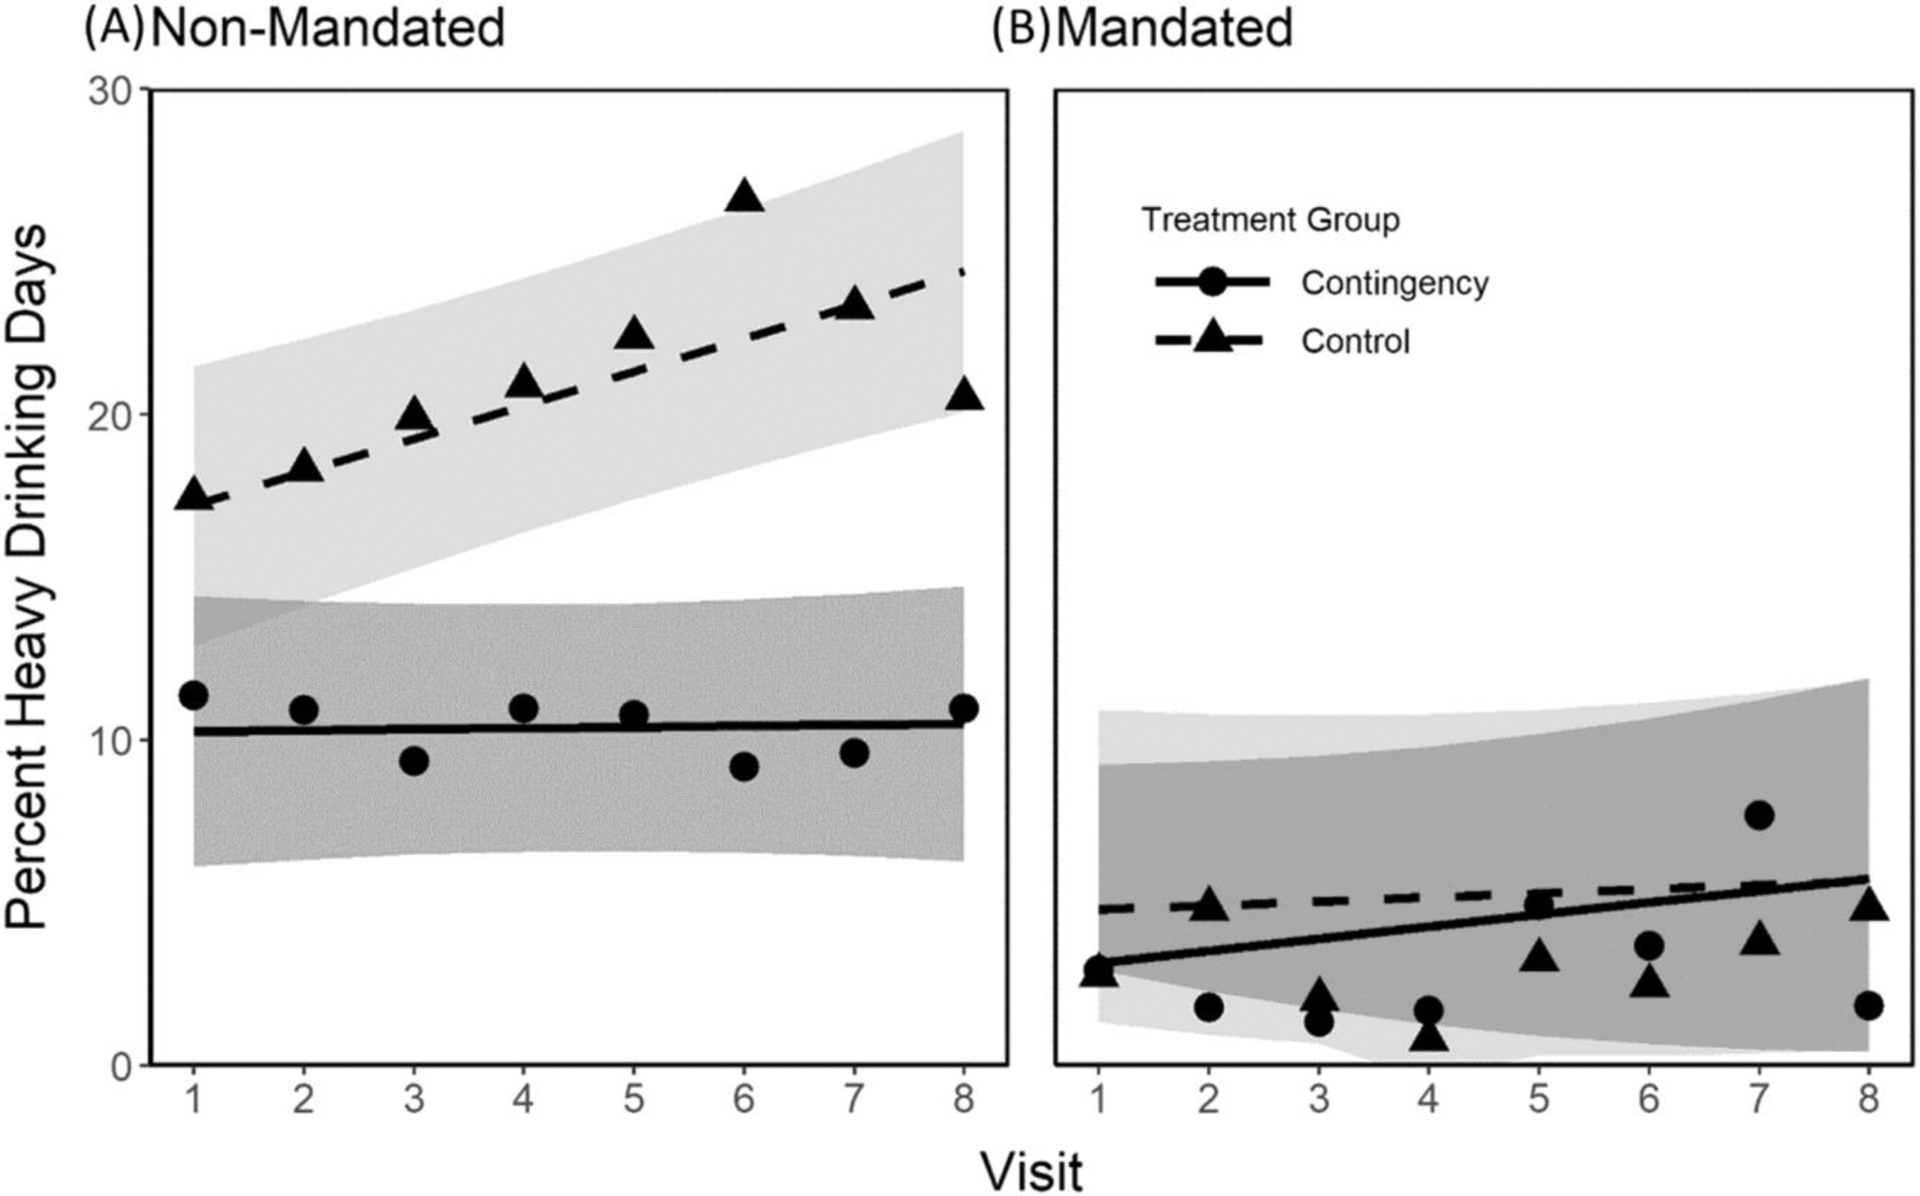
FIGURE 3.

Estimated mean of the percentage of heavy drinking days per week for each treatment and alcohol-monitoring mandating condition by week. The results for Non-Mandated participants are shown on panel (A), and the results for the Mandated participants are on panel (B). Results for participants assigned to the Control condition are represented by triangles and results for those assigned to the CM condition are represented by circles. The solid and dotted lines represent estimates for the CM and the Control group, respectively. Gray shades (dark gray: CM group; light gray: control group) indicate 95% confidence intervals for each condition.
