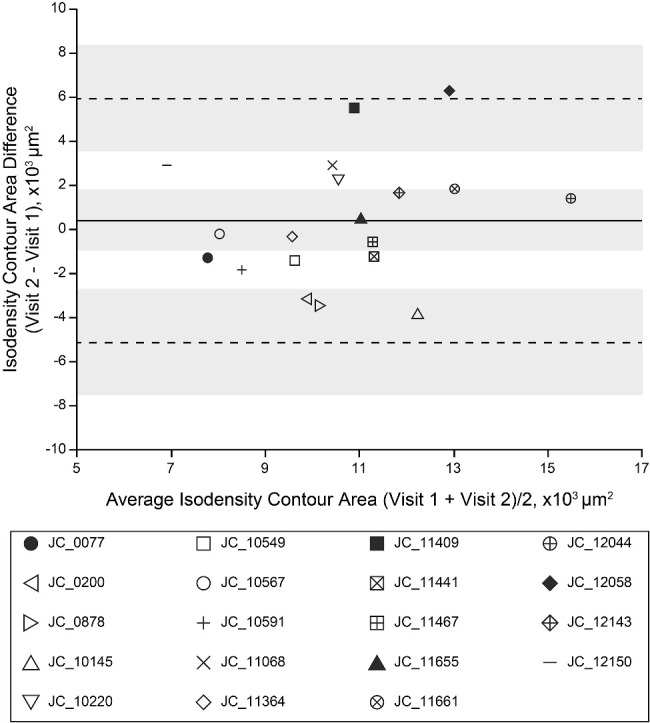
Figure 2.

Intervisit agreement of the 80th percentile isodensity contour area. Bland–Altman analysis showed variable agreement between visit 1 and visit 2 80th percentile isodensity contour areas. The solid line represents the mean bias of 451 µm2, and the dashed lines represent the upper (6010 µm2) and lower (−5110 µm2) limits of agreement. Shaded regions represent the 95% CI about the mean bias and the limits of agreement.38 Each individual is indicated by a different symbol; the four filled symbols represent individuals included in Figure 3 and Supplementary Figure S1.
