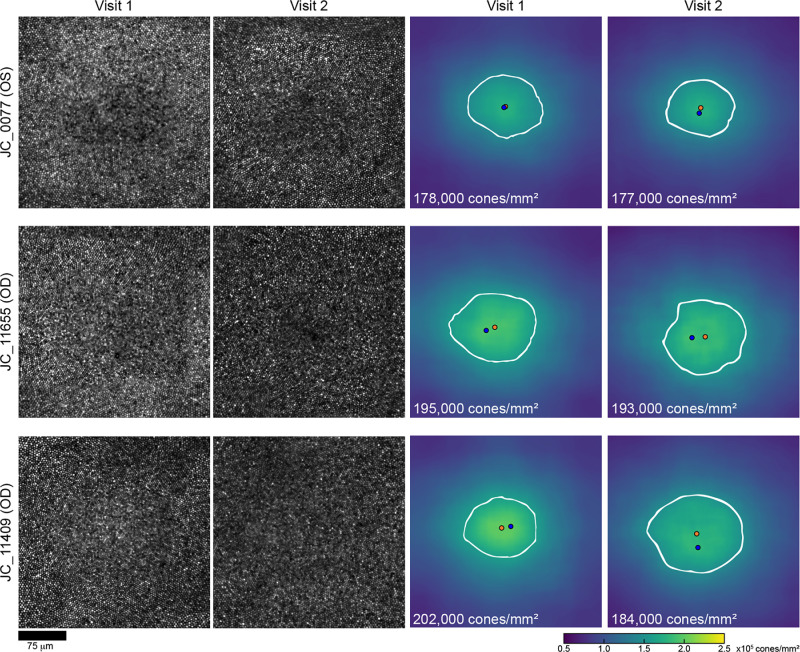
Figure 3.
Examples of changes in foveal cone density. Shown are the foveal cone mosaics from visit 1 and visit 2 for three participants ordered from top to bottom by the least to the greatest amount of change observed in linear PCD from visit 1 to visit 2. JC_0077 showed a 0.56% change in PCD, JC_11655 showed a 1.0% change in PCD, and JC_11409 showed an 8.9% change. The average absolute change seen in all participants was 4.76% for linear PCD. The blue dot on the density maps represents the PCD location, the orange dot indicates the CDC location, and the white outline represents the 80th percentile isodensity contour. Scale bar: 75 µm.

