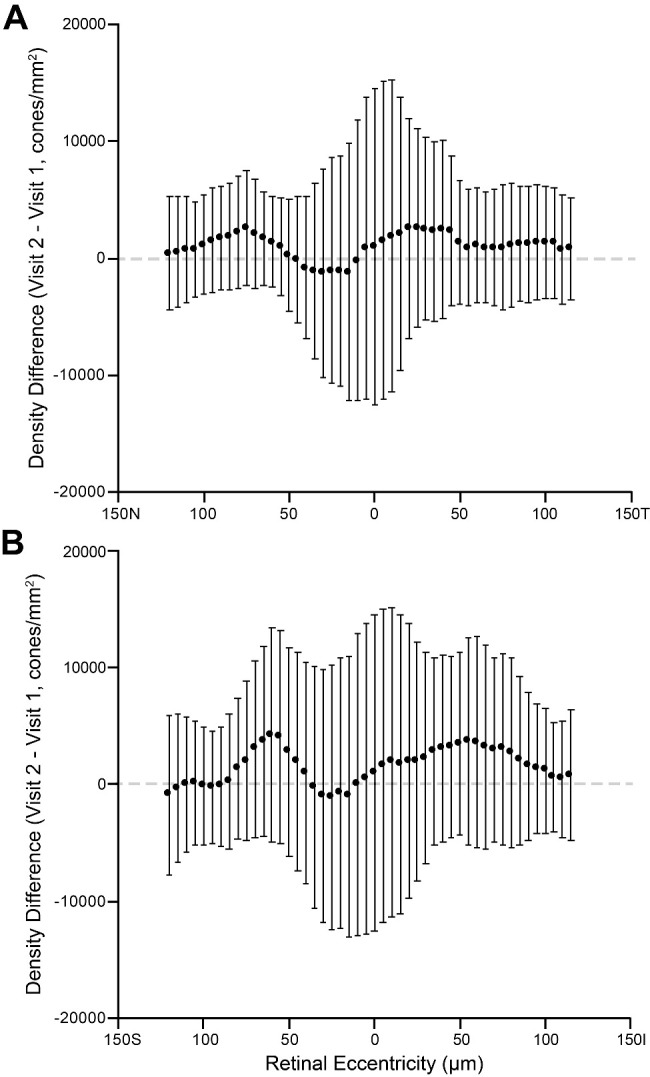
Figure 4.

Intervisit density differences. Plotted are the average density differences along the horizontal (A) and vertical (B) meridian, extracted at the location of the CDC for each difference matrix. Error bars represent the SD of differences among the 19 individual difference maps at that retinal location. The dashed line shows zero difference for reference. No systematic differences are apparent, consistent with the comparisons of PCD and density at the CDC.
