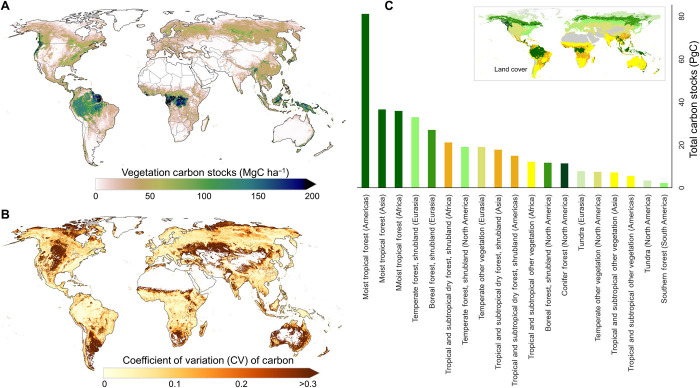
Fig. 1. Mean vegetation carbon density map (averaged from 2000 to 2019).
(A) Spatial distribution of mean global vegetation carbon density. (B) Spatial distribution of CV (coefficient of variation) in global vegetation carbon density. (C) Carbon stocks of major land cover (LC) classes (the inset figure shows the definition of LC classes; a detailed LC map is shown in fig. S1).

