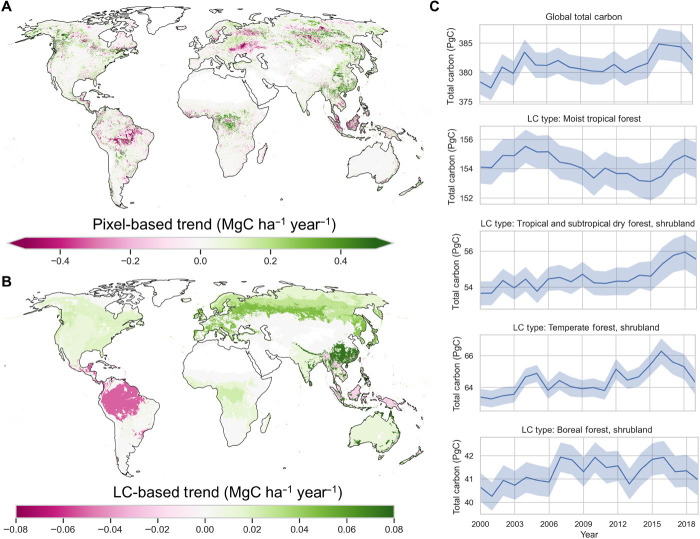
Fig. 2. Long-term (2000–2019) trend of global live vegetation biomass carbon.
(A) Pixel-level (in 10-km spatial resolution) vegetation carbon trend map. (B) LC-based trend map of vegetation carbon. (C) Time series of vegetation carbon for global and four major LC types. All trend analyses use the Mann-Kendall test, and regions with P > 0.05 were masked out.

