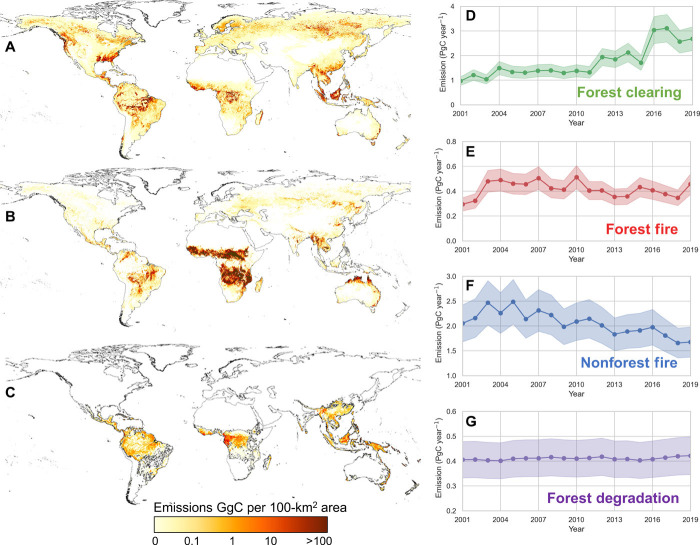
Fig. 3. Emissions from forest clearing and fire from 2000–2019.
(A) spatial distribution of average emissions from forest clearing, (B) additional average annual emissions from forest and nonforest fires not included in forest clearing, (C) average annual emissions [gigagrams carbon (GgC) year–1] from forest degradation estimated for pantropical regions, and time series of annual emissions and uncertainty from (D) forest clearing, (E) forest fire, (F) nonforest fire, and (G) forest degradation.

