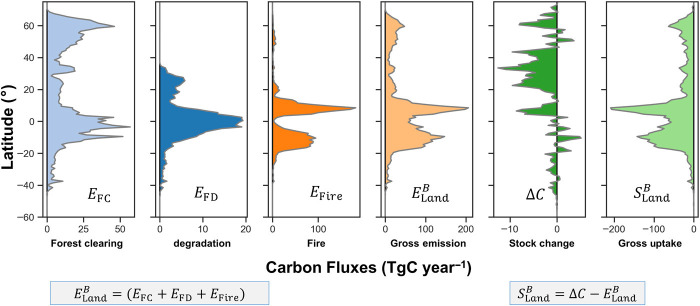
Fig. 4. Latitudinal variation of carbon fluxes of the global vegetation.
Emissions [teragrams carbon (TgC) year–1] associated with the carbon loss attributed to forest clearing (EFC), forest clearing (EFD), and forest and nonforest fire (EFire) combined to estimate total carbon loss or committed emissions from live land biomass () from 2001 to 2019. The latitudinal distribution of stock change from annual carbon maps is represented by (∆C), and the total carbon removal derived from the difference of the stock change and the total carbon loss is shown as ().

