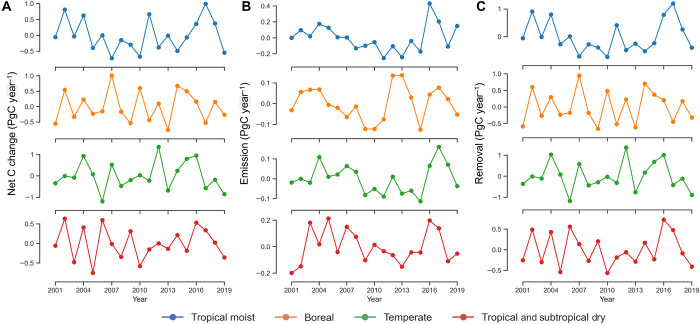
Fig. 5. Interannual variability of global stock change.
IAV (mean centered and detrended) of global net carbon stock change (A) separated into emissions (B) and removals (C) and divided into tropical moist, tropical dry and savanna, boreal, and temperate ecosystems. For global net carbon stock change, positive values indicate net emissions (source) and negative values net removals (sink). Time series in each plot are detrended using simple linear regressions.

