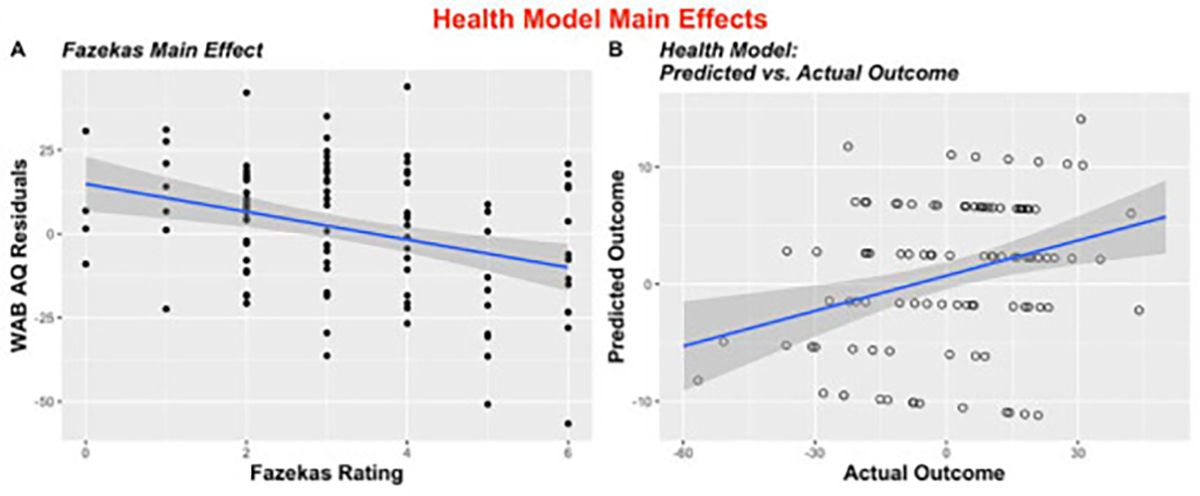
Fig. 4 –

Scatterplots to illustrate all significant (entered into >5% of iterations) main effects in the stepwise LOOCV Health Model (A) Illustration of main effect of Fazekas rating by WAB AQ residual values (p = .0004); (B) Predicted vs. actual outcomes of stepwise regression (r = −.29, p = .003).
