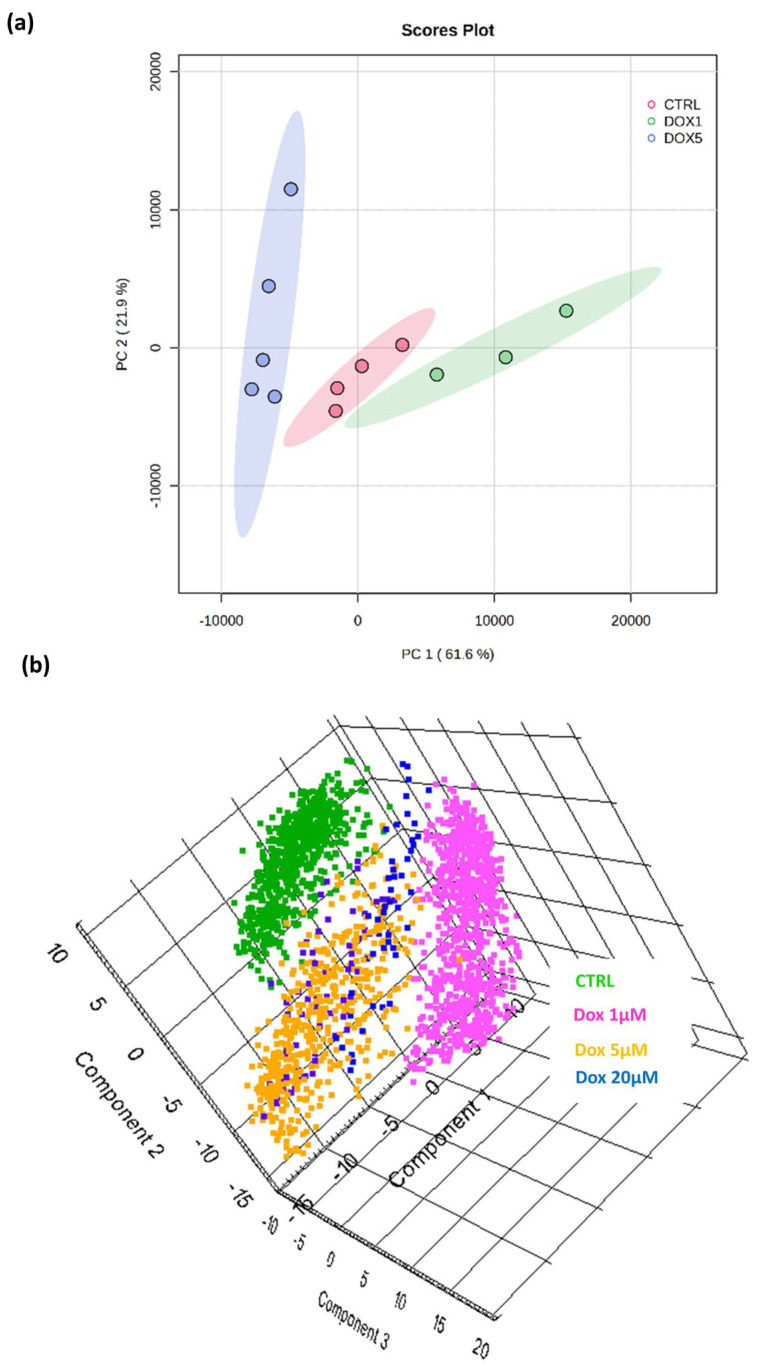
Figure 3.
Principal component analysis (a) 2D and (b) 3D score plots presenting the significant separation of the molecular composition between (a) control SAOS-2 MCTSs and 1 μM, 5 μM (b) and 20 μM doxorubicin-treated MCTSs. Plots were generated from ROI feature lists exported to (a) MetaboAnalyst v5.0 with mean-centring scaling applied and (b) SCiLS Labs Software with unit variance scaling applied. PC1 (61.6%) and PC2 (21.9%).

