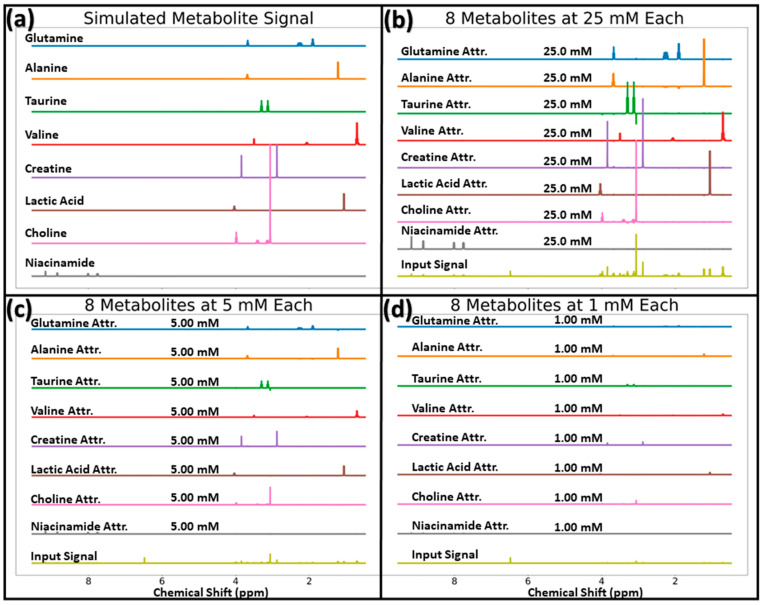
Figure 3.
Ground truth metabolite signals (panel (a)) for the eight metabolites the model is trained to quantify, and MLP-Sim attribution scores and their respective input signals for inputs with all 8 analytes at 25, 5, and 1 mM for the panels (b–d), respectively. The predicted concentrations are displayed above each output node’s attribution scores. Abbreviations: Attr. = Attribution scores.

