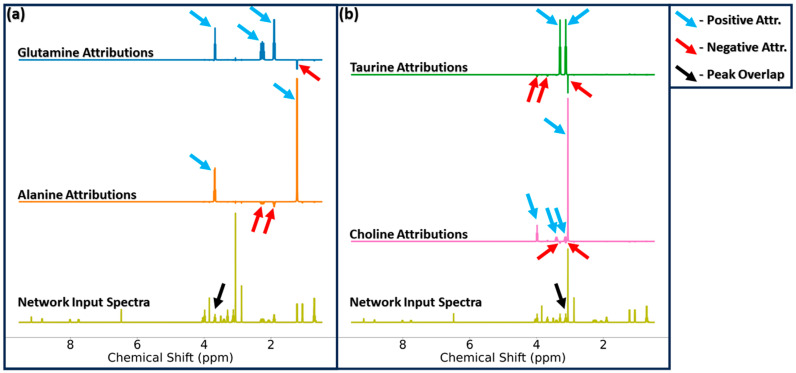
Figure 4.
Glutamine and alanine attributions (panel (a)) and taurine and choline attributions (panel (b)) for the MLP-Sim input spectra of all eight analytes at 25 mM. The black arrow highlights the frequency range in which these signals overlap in the mixture spectrum. Blue arrows denote areas of positive attribution corresponding directly to that output node’s respective metabolite. Red arrows denote frequencies of negative attribution scores which compensate for the increased intensity experienced with the overlapping resonances. Abbreviations: Attr. = Attribution scores.

