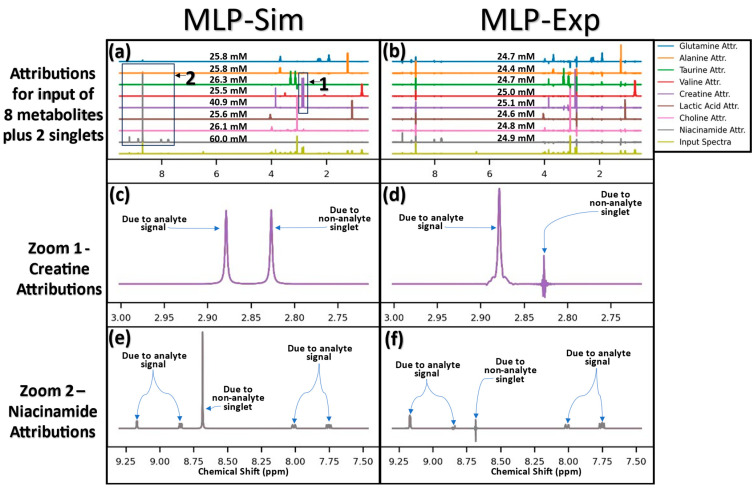
Figure 5.
Attributions for MLP-Sim (left side) and MLP-Exp (right side) for the input spectrum of all eight analytes at 25 mM plus two randomly added singlets (peak maxima at ~2.82 and ~8.70 ppm). Zoomed in regions of creatine and niacinamide are shown in the bottom four panels, with the ROIs denoted by “1” and “2” in panel (a). The panels show: (a) MLP-Sim attribution scores for all 8 metabolites plus the input spectrum, (b) MLP-Exp attribution scores for all 8 metabolites plus the input spectrum, (c) zoom of MLP-Sim creatine attribution scores, (d) zoom of MLP-Exp creatine attribution scores, (e) zoom of MLP-Sim niacinamide attribution scores, and (f) zoom of MLP-Exp niacinamide attribution scores. Abbreviations: Attr. = attribution scores.

