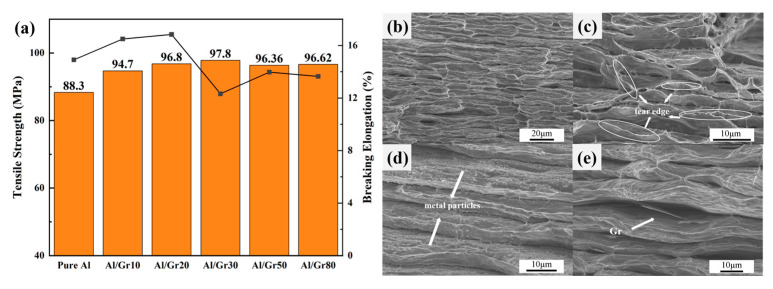
Figure 4.
(a) Engineering stress–strain curves for Al/Gr composites and the unreinforced Al matrix fabricated by hot pressing at 50 MPa and 655 °C; the bar chart represents tensile strength, and the line chart represents fracture strain. Cross-sectional SEM images of (b) pure Al, (c) Al/Gr10, (d) Al/Gr30 and (e) Al/Gr50 composites.

