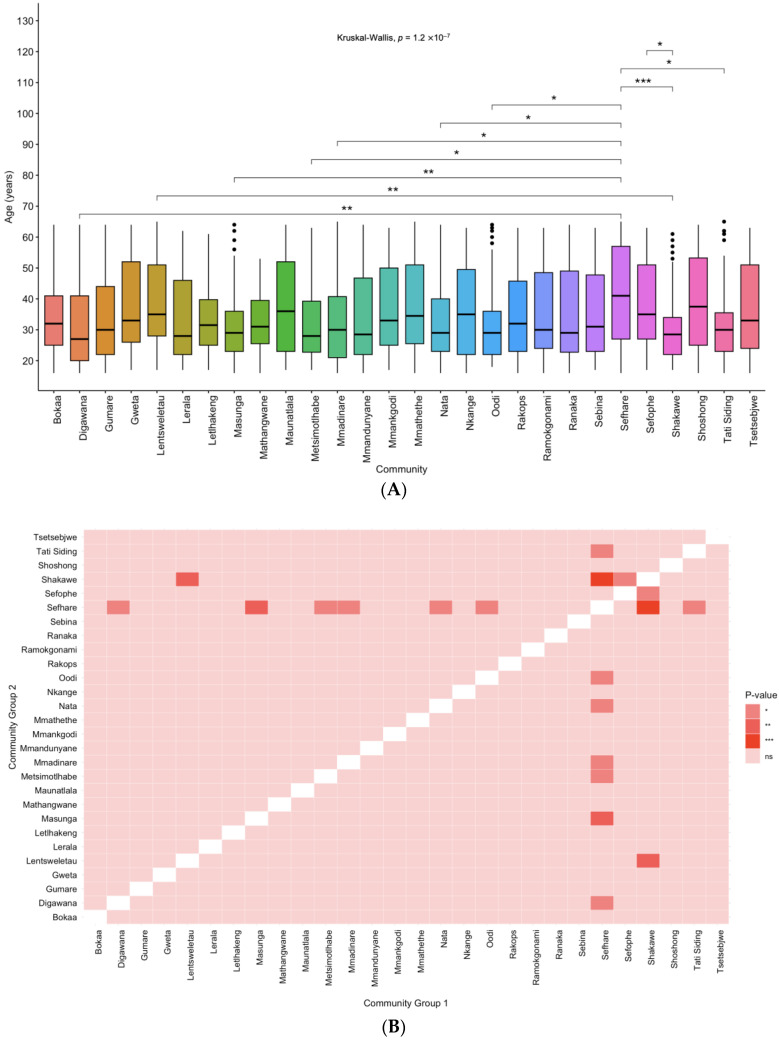
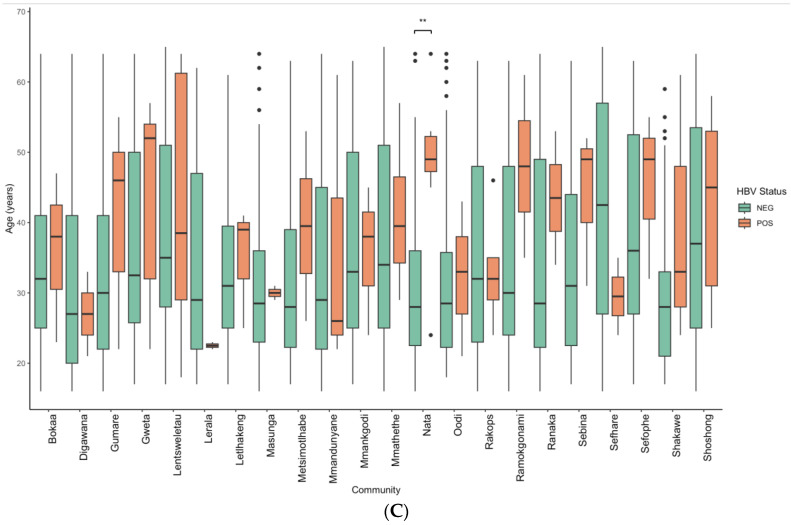
Figure 2.
(A) Age by community, (B) Heat map showing differences in age distribution between communities, (C) Boxplots showing the age distribution across the BCPP communities with both HBV negative (green) and positive (orange) cases. Pairwise comparison was conducted by age between communities and between HBV negative and positive cases using Wilcoxon test. The significance levels of ns, *, **, and *** represent p-values > 0.05, <0.05, <0.01 and <0.001, respectively.


