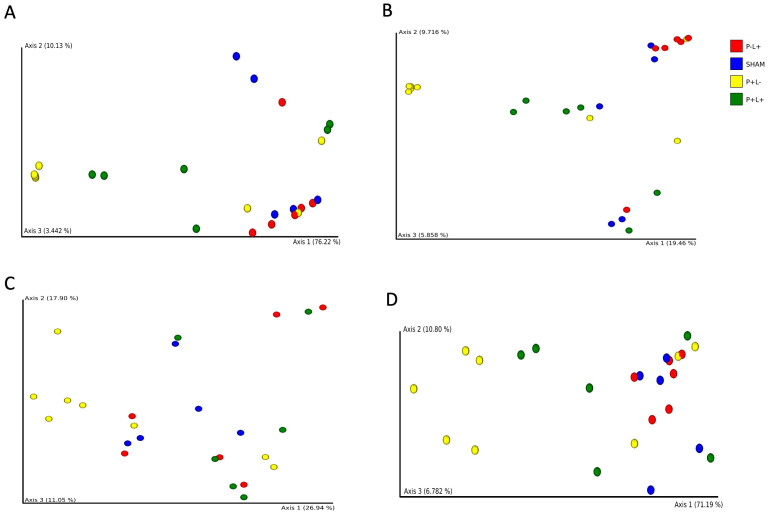
Figure 3.
Principal Coordinates Analyses (PCoA) based on Bray–Curtis (A), Jaccard (B), unweighted (C) and weighted (D) Unifrac distances of oral microbial communities of C57Bl/6 mice submitted to different treatments: SHAM (negative control), P+L- (positive control, inoculated with the microbial consortium), P-L+ (L. acidophilus LA5), P+L+ (microbial consortium + L. acidophilus LA5). Each dot represents one sample.

