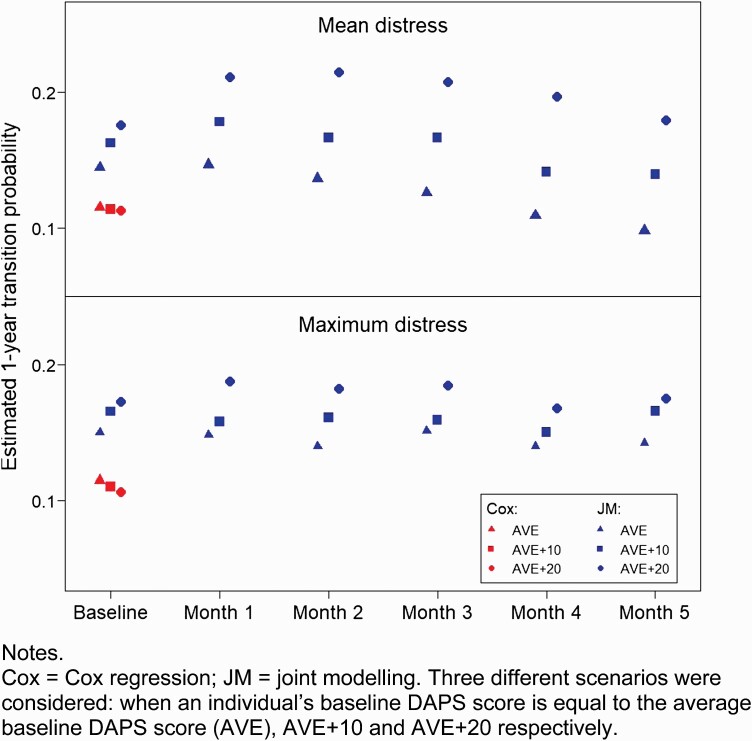
Fig. 1.
Association between mean/maximum DAPS score and 1-year transition risk using baseline and longitudinal values. Note: Cox, Cox regression; JM, joint modeling. Three different scenarios were considered: when an individual’s baseline DAPS score is equal to the average baseline DAPS score (AVE), AVE + 10 and AVE + 20, respectively.

