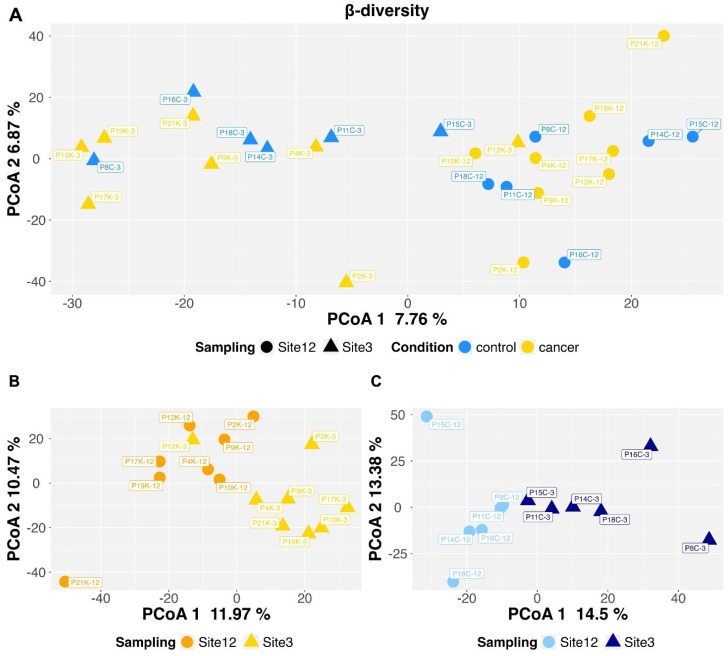
Figure 2.
Principal coordinates analysis (PCoA) representation by applying the Aitchison distance to CLR-transformed data. Panel (A): overall data representation. Panels (B,C): distinguished PCoA analysis for cancer (PERMANOVA p-value = 0.0005) and control (PERMANOVA p-value = 0.0013) cases, respectively.

