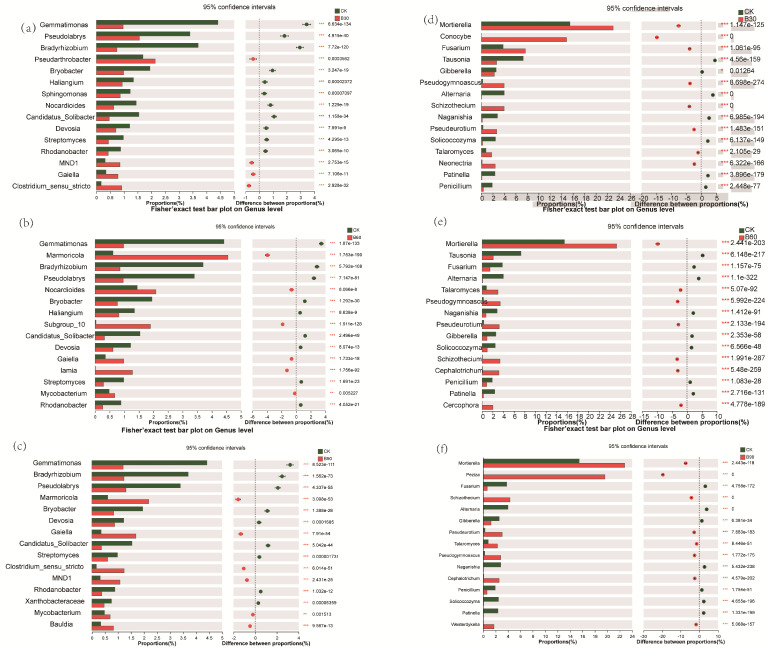
Figure 4.
The figure shows the difference in the relative abundance of bacteria CK-B30 (a), CK-B60 (b), and CK-B90 (c) and fungi CK-B30 (d), CK-B60 (e), and CK-B90 (f) in the rhizosphere soil of Perilla frutescens at the genus level. On the right is the p-value. “*” indicates a significant difference between the two data sets (n = 3, p < 0.05); “**” indicates a highly significant difference between the two data sets (n = 3, p < 0.01); and “***” indicates a highly significant difference between the two data sets (n = 3, p < 0.001), using Welch’s t-test.

