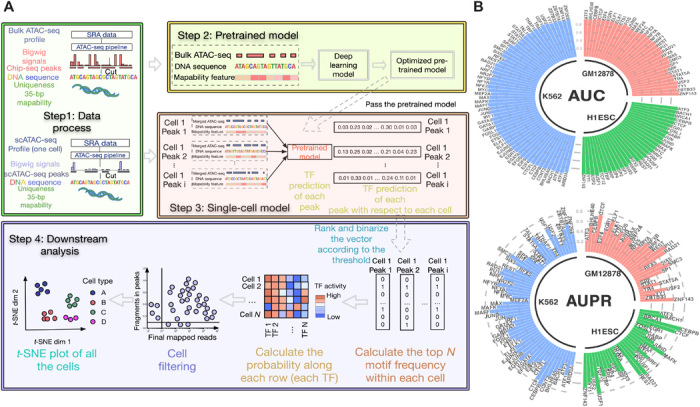
Fig. 1. scFAN pipeline and classification performance on bulk data.

(A) scFAN pipeline. Bulk ATAC-seq, mapability data, and regions of DNA identified by ChIP-seq data are passed to the deep learning “pretrained model.” The trained model is then used to predict TF binding profiles based on regions of DNA called by scATAC-seq, mapability data, and a combination of scATAC-seq and bulk ATAC-seq. TF “activity scores” are calculated from the predictions by summing the number of times the top 2 most frequent TFs appear per cell. scFAN cluster cells from these activity scores. (B) Circular barplots showing AUC and auPR values of all the TFs from the pretrained model, from three different cell lines.
